JB74 gear ratios and gearing
This is an evolving page, but is brought about as I’m seeing more and more people share a couple of quick graphs I made up. Eventually I’d like to make it easier to do your own gearing calculations especially for reduction gearing and large tyre combinations, but for now you can all cope with some graphs while I work on the back end tech.
Sections
- Specifications
- Road speeds and revs – auto and manual
- What does this mean for how they drive?
- What gear should I be in?
- High and low range gearing and speeds
- Changes with larger tyres
- Reduction gearing
- Deeper dive: apparent thrust
- Nerdy stuff: how to calculate this sort of thing
Specifications
This comes up a lot as the auto and manual diff gears and transfer case differ from generation 3 Jimnys. I have based this off the official Suzuki Australia specifications, supplemented with Suzuki New Zealand who bother to also publish the transfer case ratios. Stall ratio is from the workshop manual. I’m confident they are correct, and they perfectly correlate with speeds and revs in the real world. Auto and manual diffs and also transfer cases have different part numbers, too, so they’re definitely not the same.
This information is true for at least 2019 through 2023 Jimnys. I’ll update it if things change.
| Manual JB74 | Automatic JB74 | |
|---|---|---|
| Stall ratio / speed | N/A | 1.85:1 2 050 – 2 650 rpm |
| 1st | 4.42:1 | 2.88:1 |
| 2nd | 2.3:1 | 1.57:1 |
| 3rd | 1.67:1 | 1:1 |
| 4th | 1.19:1 | 0.7:1 |
| 5th | 1:1 | N/A |
| High range | 1:1 | 1.32:1 |
| Low range | 2:1 | 2.64:1 |
| Differential | 4.09:1 | 4.300:1 |
The gearing often prompts people to ask questions like “does the auto rev a lot more on the highway than the manual?” or “wouldn’t the auto be better due to the overdrive top gear?”. It’s worth understanding how all the gearing interracts rather than just looking at one specific ratio within the whole set.
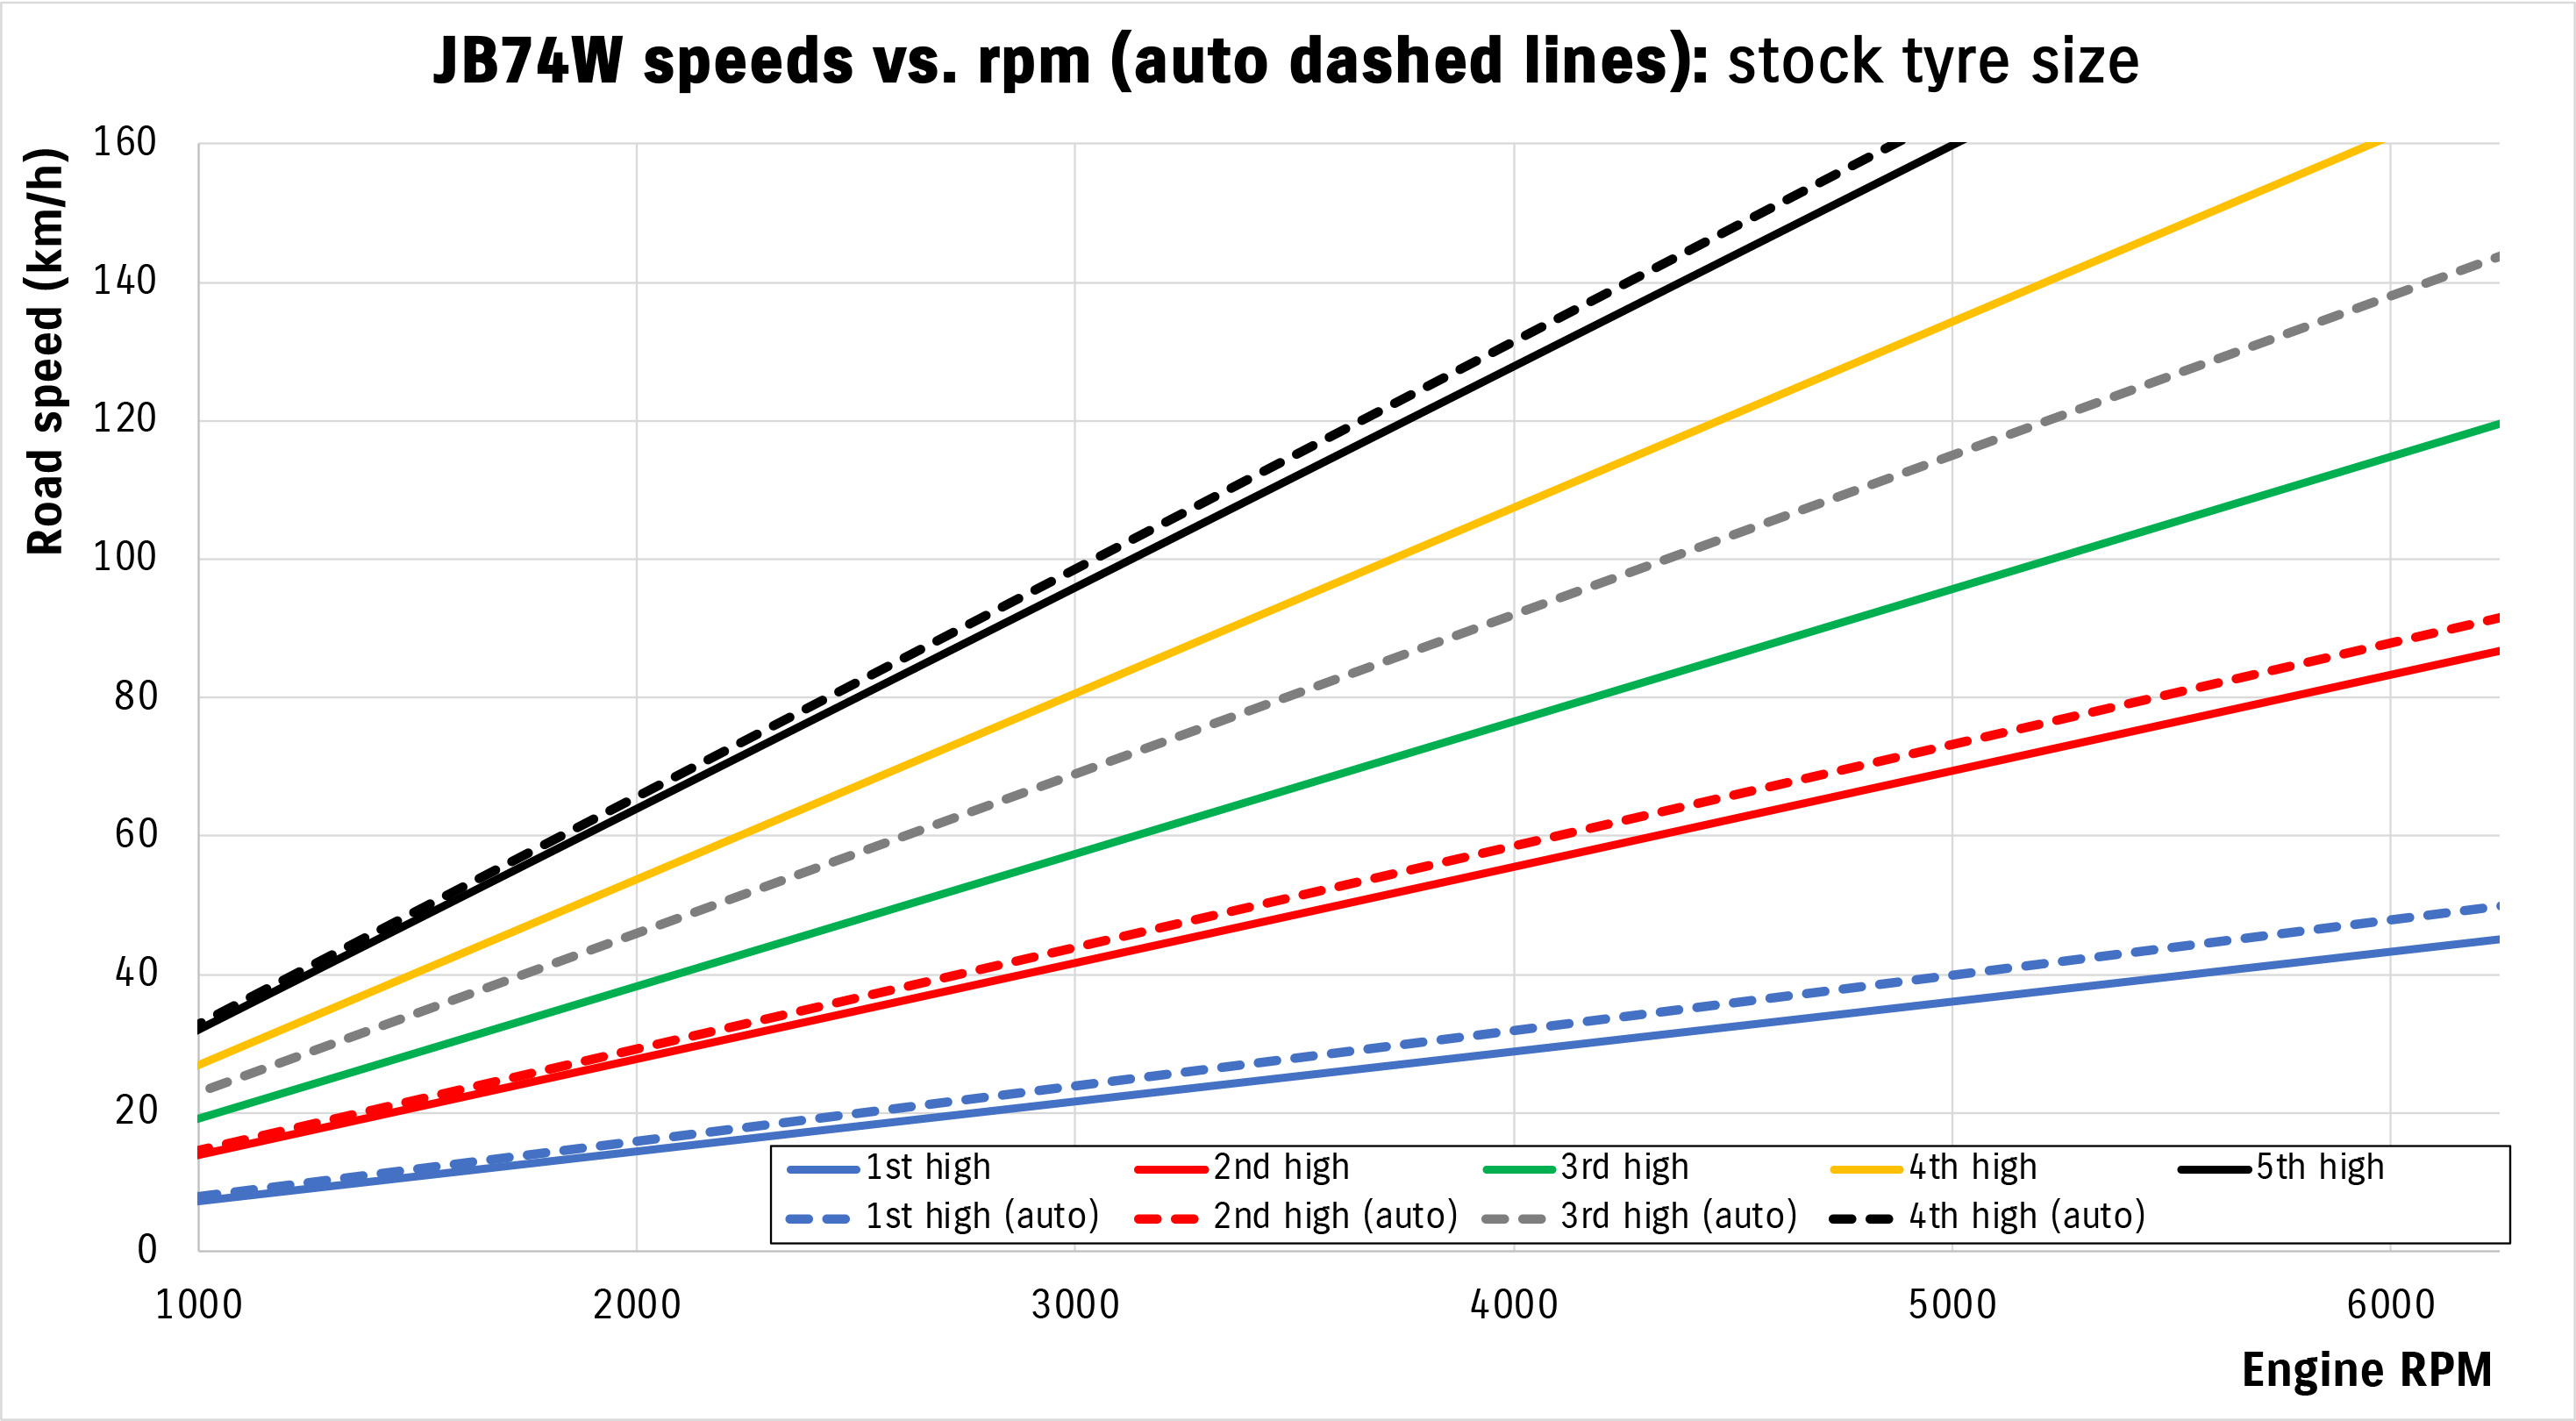
Road speeds and revs – auto and manual
Fortunately it’s all very easy to calculate out how gearing works in terms of what engine speeds give you what road speeds. Right at the bottom of the page I explain the details behind this if you wanna get extra nerdy.
What does this mean for how they drive?
People really get hung up on the potential differences between the auto and the manual. It’s understandable, given a 4 speed auto or 5 speed manual is kind of antiquated for a ‘new’ 2020s car, but ultimately it’s closer than people think between the two transmissions. Fundamentally though:
1. The auto and the manual aren’t much different on the highway.
The overall gearing works out to be basically identical in the respective top gear for each transmission type. The auto revs marginally less when the converter is locked up at highway speeds, but it’s fractional (~40 rpm at 110 out of 3300 or so…: i.e. 1% different).
Going up hills it might get a bit complicated to know what’s best. In the manual you have a choice of 2 gears to go back to, whereas the auto can only drop to 3rd practically at highway speeds. If you have a moderate hill, though, the torque converter can unlock and remain in 4th which will give you a few more revs and torque, at the expense of using a bit of energy through how torque converters work (hence worse fuel economy). The manual can drop back to 4th or if the hill is particularly steep it can grab 3rd and still maintain highway speed (albeit revving its little heart out), whereas a steep hill is going to see the auto have to slow down enough to go all the way back to 2nd.
I’ll revist this topic a bit in the concept of apparent thrust which is a more technical way to look at how much oomph is being put down to the road.
2. The manual is not that much harder to live with in stop-start traffic.
This is the flipside to the auto being thought of as worse for the highway. The manual’s clutch is very light; the short 1st gear also means you can very easy release the clutch with no throttle and just crawl along in traffic quite easily. The engine being happy to rev also means you don’t need to immediately grab 2nd gear, either. The manual is significantly quicker to accelerate due to the shorter first gear and the direct connection between engine and transmission: a torque converter can soak up a lot of power even if it has the benefit of some torque multiplication.
3. They each have their pros and cons offroad
General thinking many years ago used to be manuals were significantly better offroad as you were locked into the gear you asked for and that was it; autos were prone to upshifting at the wrong time, not downshifting early enough and generally were a lot worse. The advent of modern electronic transmission control – even on ‘old’ 4 speed autos like the Jimny has – really flipped the script so most people now regard autos as better offroad.
Automatic gearboxes are a lot easier to crawl with especially up rocks. The torque converter also acts as a bit of a buffer, smoothing out driveline jerks as you thump over rocks and things. In sand, the auto can downshift as needed especially climbing up dunes and things. In a manual you get what you get; crawl speed is dictated by gearing or your desire to abuse the clutch, and downshifting in sand at speed is not a good idea.
On the flipside crawling down a slope is always much easier in a manual as you let the engine braking and the shorter gearing do the work for you. While the Jimny has hill descent control it does work via the brakes; the less work you have to make the brakes do the better, and the manual will win at this challenge every day of the week where you’re low and slow with the revs and speed.
This leads very nicely to a discussion about how the high and low range gearing works; most people get confused because the apparently much shorter auto low range makes them think it works quite differently.
What gear should I be in?
With the Jimny having greater manual penetration than most new cars out there, you do get a few people buying Jimnys who’ve never had a manual car previously. Sometimes these people want some advice on what gear to be in for what situation. There are a few things that dictate what gear you might want to be in:
- How much load are you putting on the engine?
If you’re on the flat and you can sneak along with minimal throttle then the engine can cope with lower rpm than if you need to climb something or you have more weight in the car. - What sort of acceleration or deceleration is expected?
If you only expect to accelerate you can more easily tolerate being at the ‘lower end’ of acceptable for a gear; if you will need to speed up and also slow down, such as when you’re in moving but dense traffic, you’ll need a gear where you have flexibility in the rev range.
In general, higher gears are harder to carry for the purposes of acceleration. You can accelerate cleanly away from idle in first gear; if you are in 5th gear idling then the engine will noticeably shake and vibrate from having too much load on it. This means the ‘minimum’ engine speed for a gear is higher for higher gears.
There’s also a grey area once you are thinking about lower rpm ranges: in higher gears you might be able to gradually sneak along with minimal throttle and sneak up to a speed where you can then more cleanly accelerate; so there’s a couple of rpm ranges to consider. This gives you options in traffic: if you’re able to lightly sneak up on the throttle initially you can get away with a higher gear than you otherwise might.
At the upper end, you have diminishing returns between peak torque @ 4000 rpm and maximum power at 6000 rpm. You can be there, but really only if you want to extract maximum power. If you’re not going for maximum acceleration, once you’re in this zone you might want to consider upshifting.
Summing this up in a table, I feel like a manual Jimny with the K15B engine sort of has these practical RPM (and hence road speed) options.
| Gear | Idle road speed | Practical minimum rpm @ speed | Cleanly accelerate rpm @ speed | Max torque speed |
|---|---|---|---|---|
| 1 | 5 km/h | 750 rpm, 5 km/h | 750 rpm, 5 km/h | 29 km/h |
| 2 | 10 km/h | 1000 rpm, 14 km/h | 1000 rpm, 14 km/h | 56 km/h |
| 3 | 14 km/h | 1200 rpm, 23 km/h | 1350 rpm, 26 km/h | 76.5 km/h |
| 4 | 20 km/h | 1400 rpm, 38 km/h | 1800 rpm, 48 km/h | 107 km/h |
| 5 | 24 km/h | 1500 rpm, 48 km/h | 2000 rpm, 64 km/h | 128 km/h |
High and low range gearing and speeds
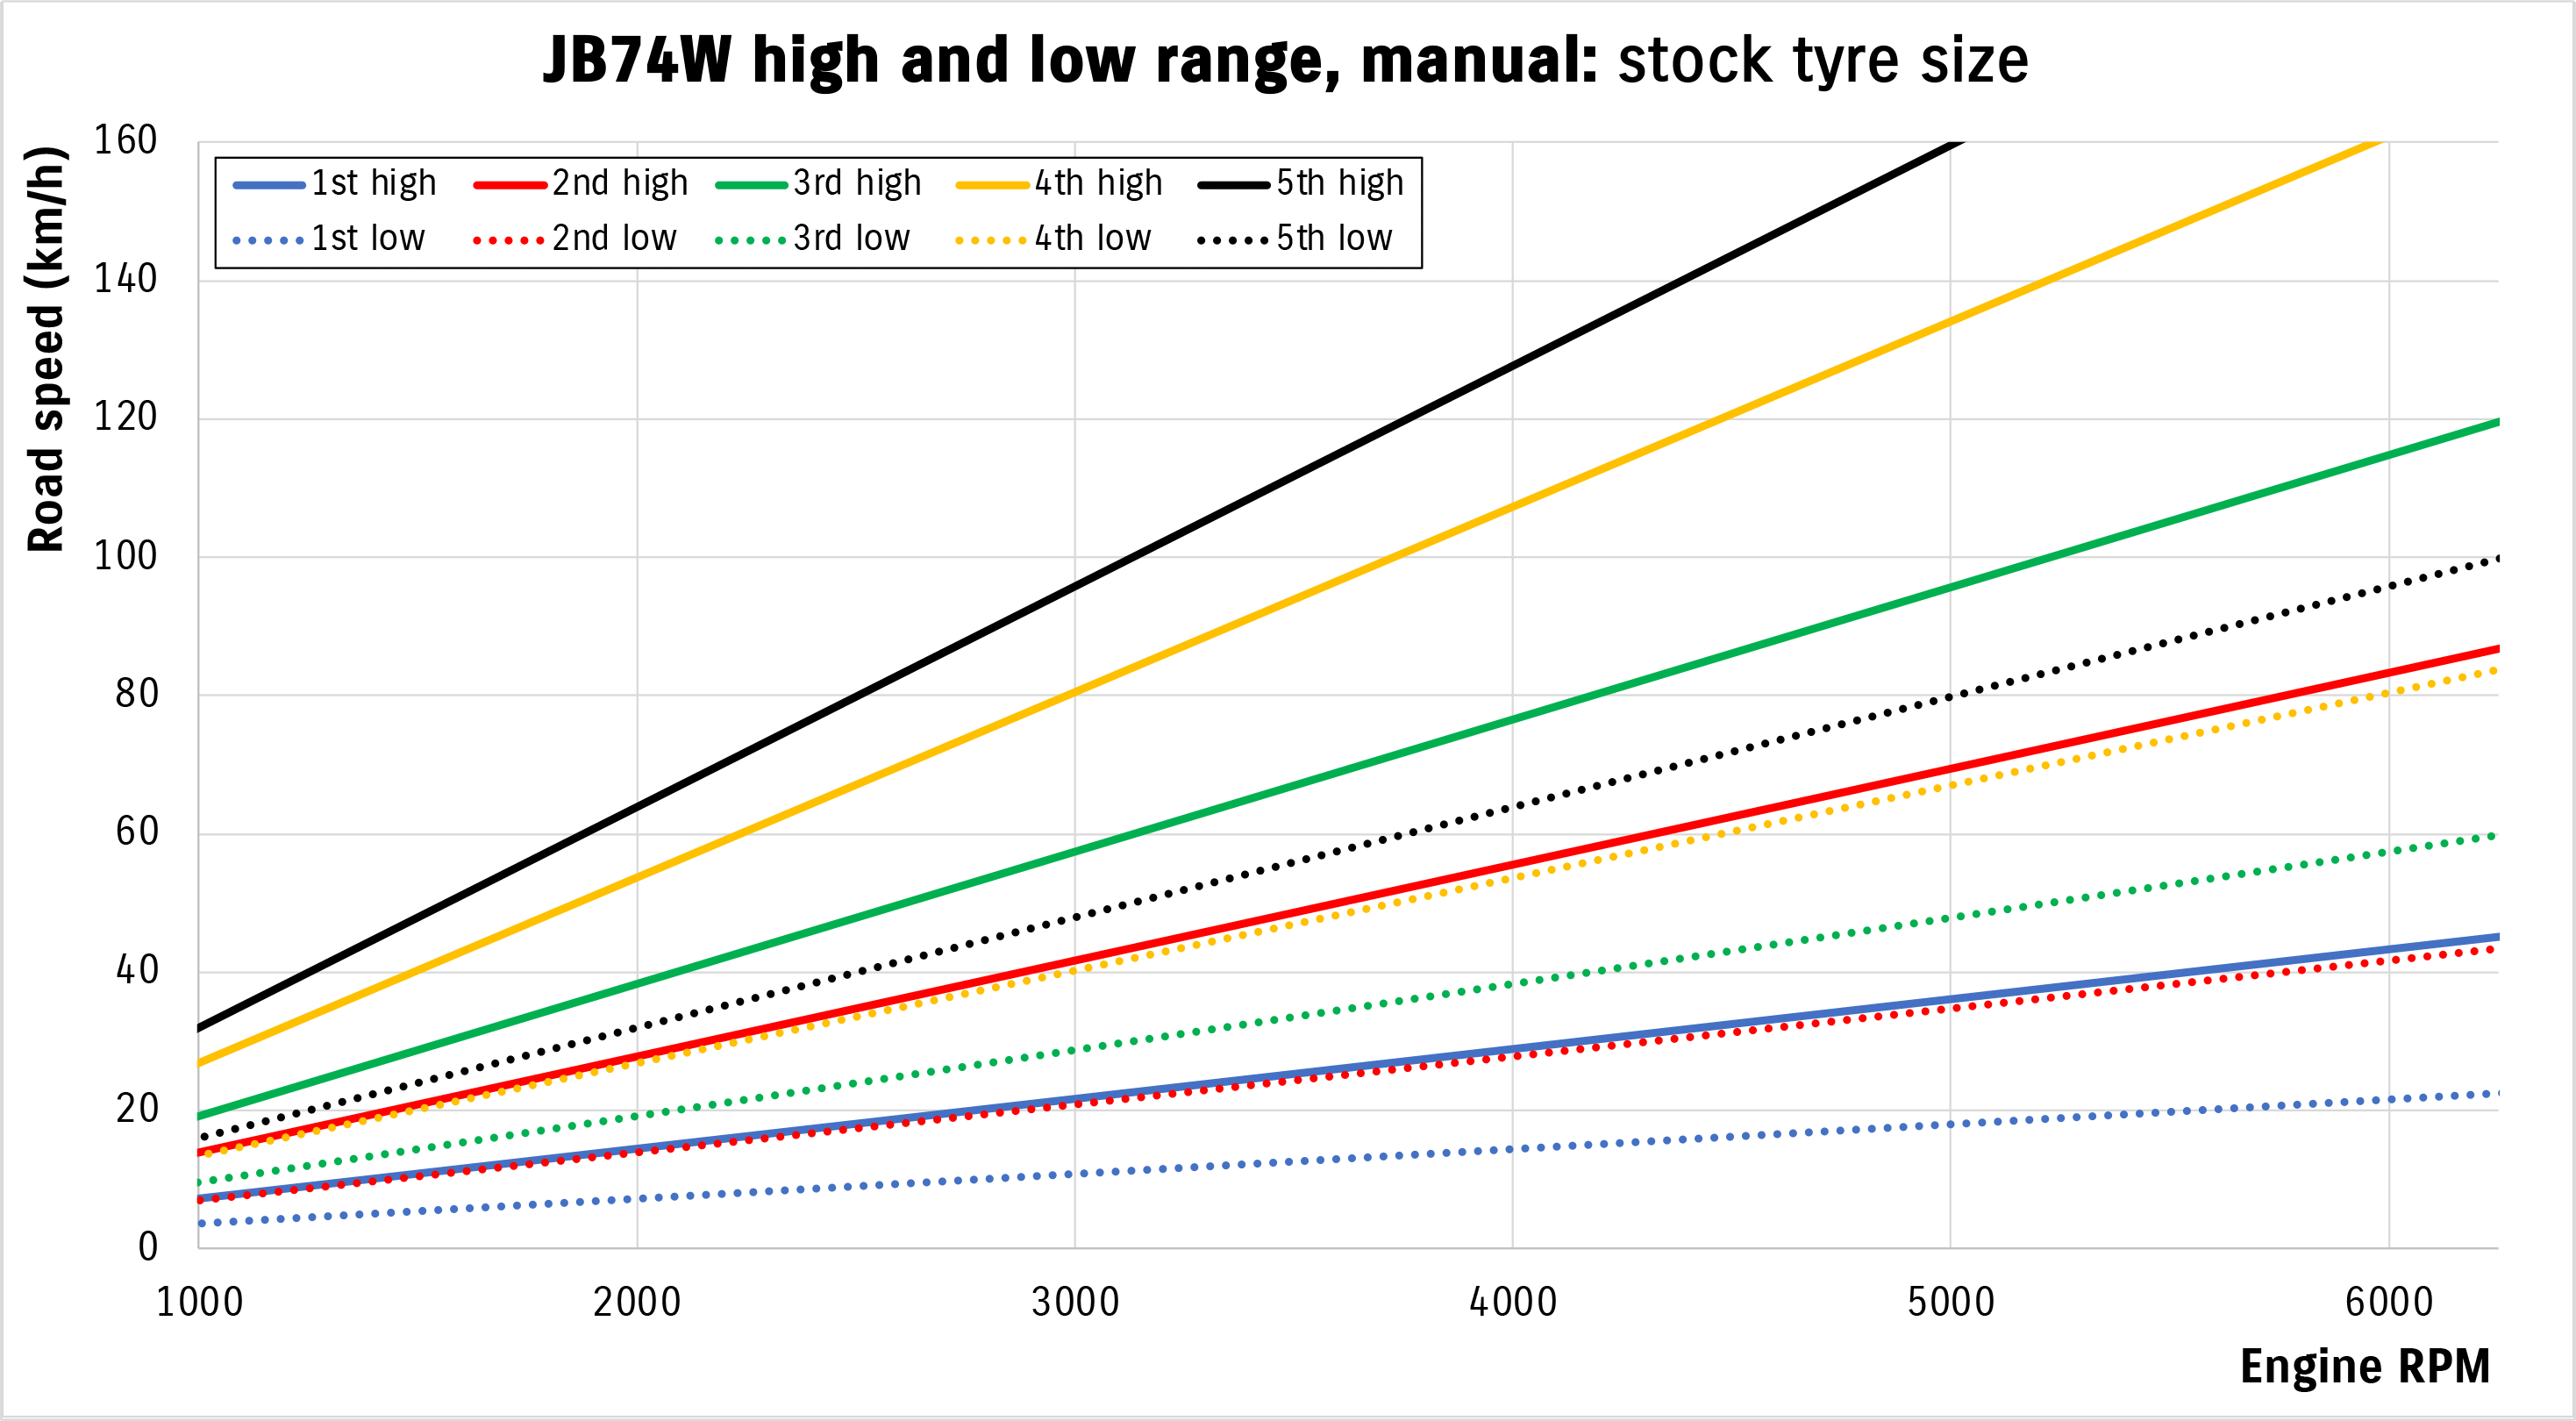
On the face of it the gearing in high and low range seems quite different. For high range, the manual is 1:1 so what you spin it into the transfer case is what you get out; the auto is a 32% reduction. When you look at low range the manual is 2:1, but the auto is 2.64:1 – surely that means it crawls much slower?
Well, no: basically low range is exactly half the speed of high range for both. It’s that simple. This is how that looks for the manual:
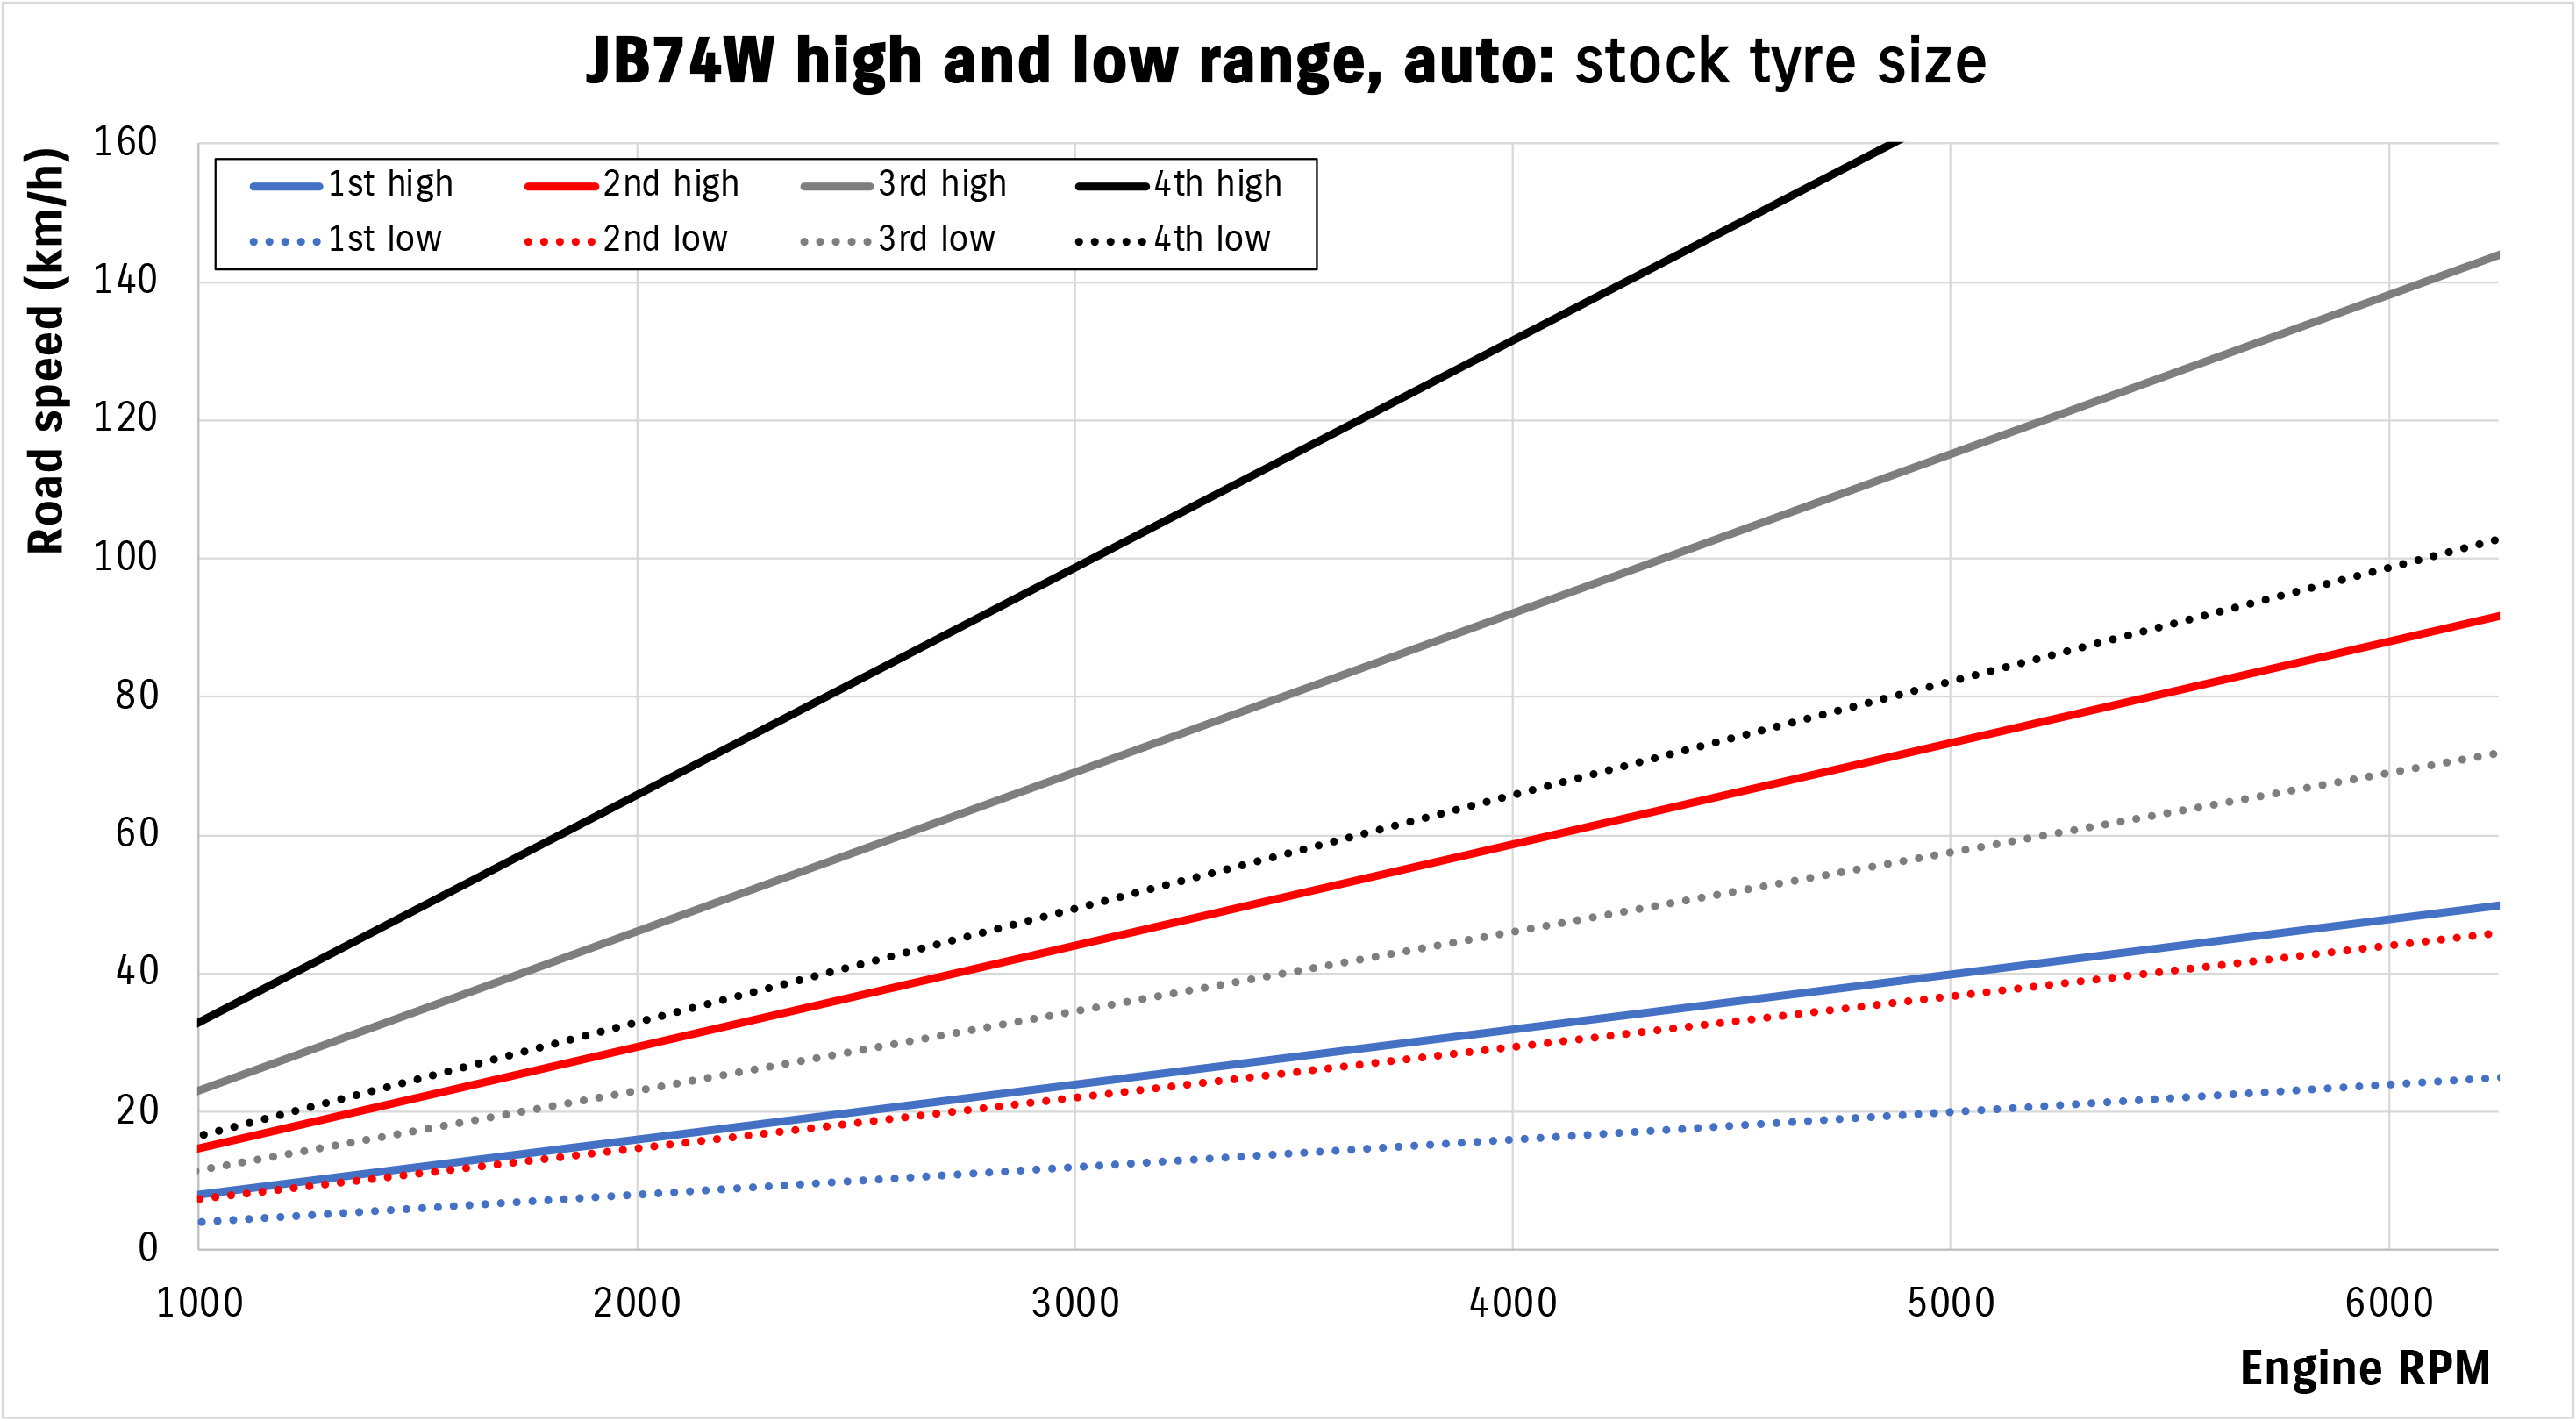
… and how it looks for the auto:
Couple of takeaways here:
For the manual, 2nd gear low is almost exactly first gear high, and 4th low is almost exactly 2nd gear high. In other words, if you think 2nd gear high gives you momentum for a dune run, you can also use 4th gear low for exactly the same momentum, but more flexibility with an option for first-and-a-half as it were.
In the auto it’s a bit more complicated, especially as you can’t really force upshifts in the Jimny (you can use the gear lever to lock it out of upshifting though). Once again 2nd gear in low range is basically the same as first gear high range, but 3rd in low range is quite a bit shorter than 2nd in high range, and 4th in low range is that bit longer. It can be harder to get it to want to upshift into 4th in low range, though, which might make it more limiting to carry momentum. In any case, low range is good (theoretically) for ~100 km/h; while some people vaguely make arguments about windup at high speeds in low range, that’s not exactly how drivelines work either. I certainly have run my car at reasonable speed in low range which is a great way to have ESP off even above 30 km/h, and also gives more flexibility in gear choices for tackling obstacles.
If we zoom in a bit and focus on the kinda most crucial 0-60 km/h zone, here’s what the manual and auto look like just in low range respectively:
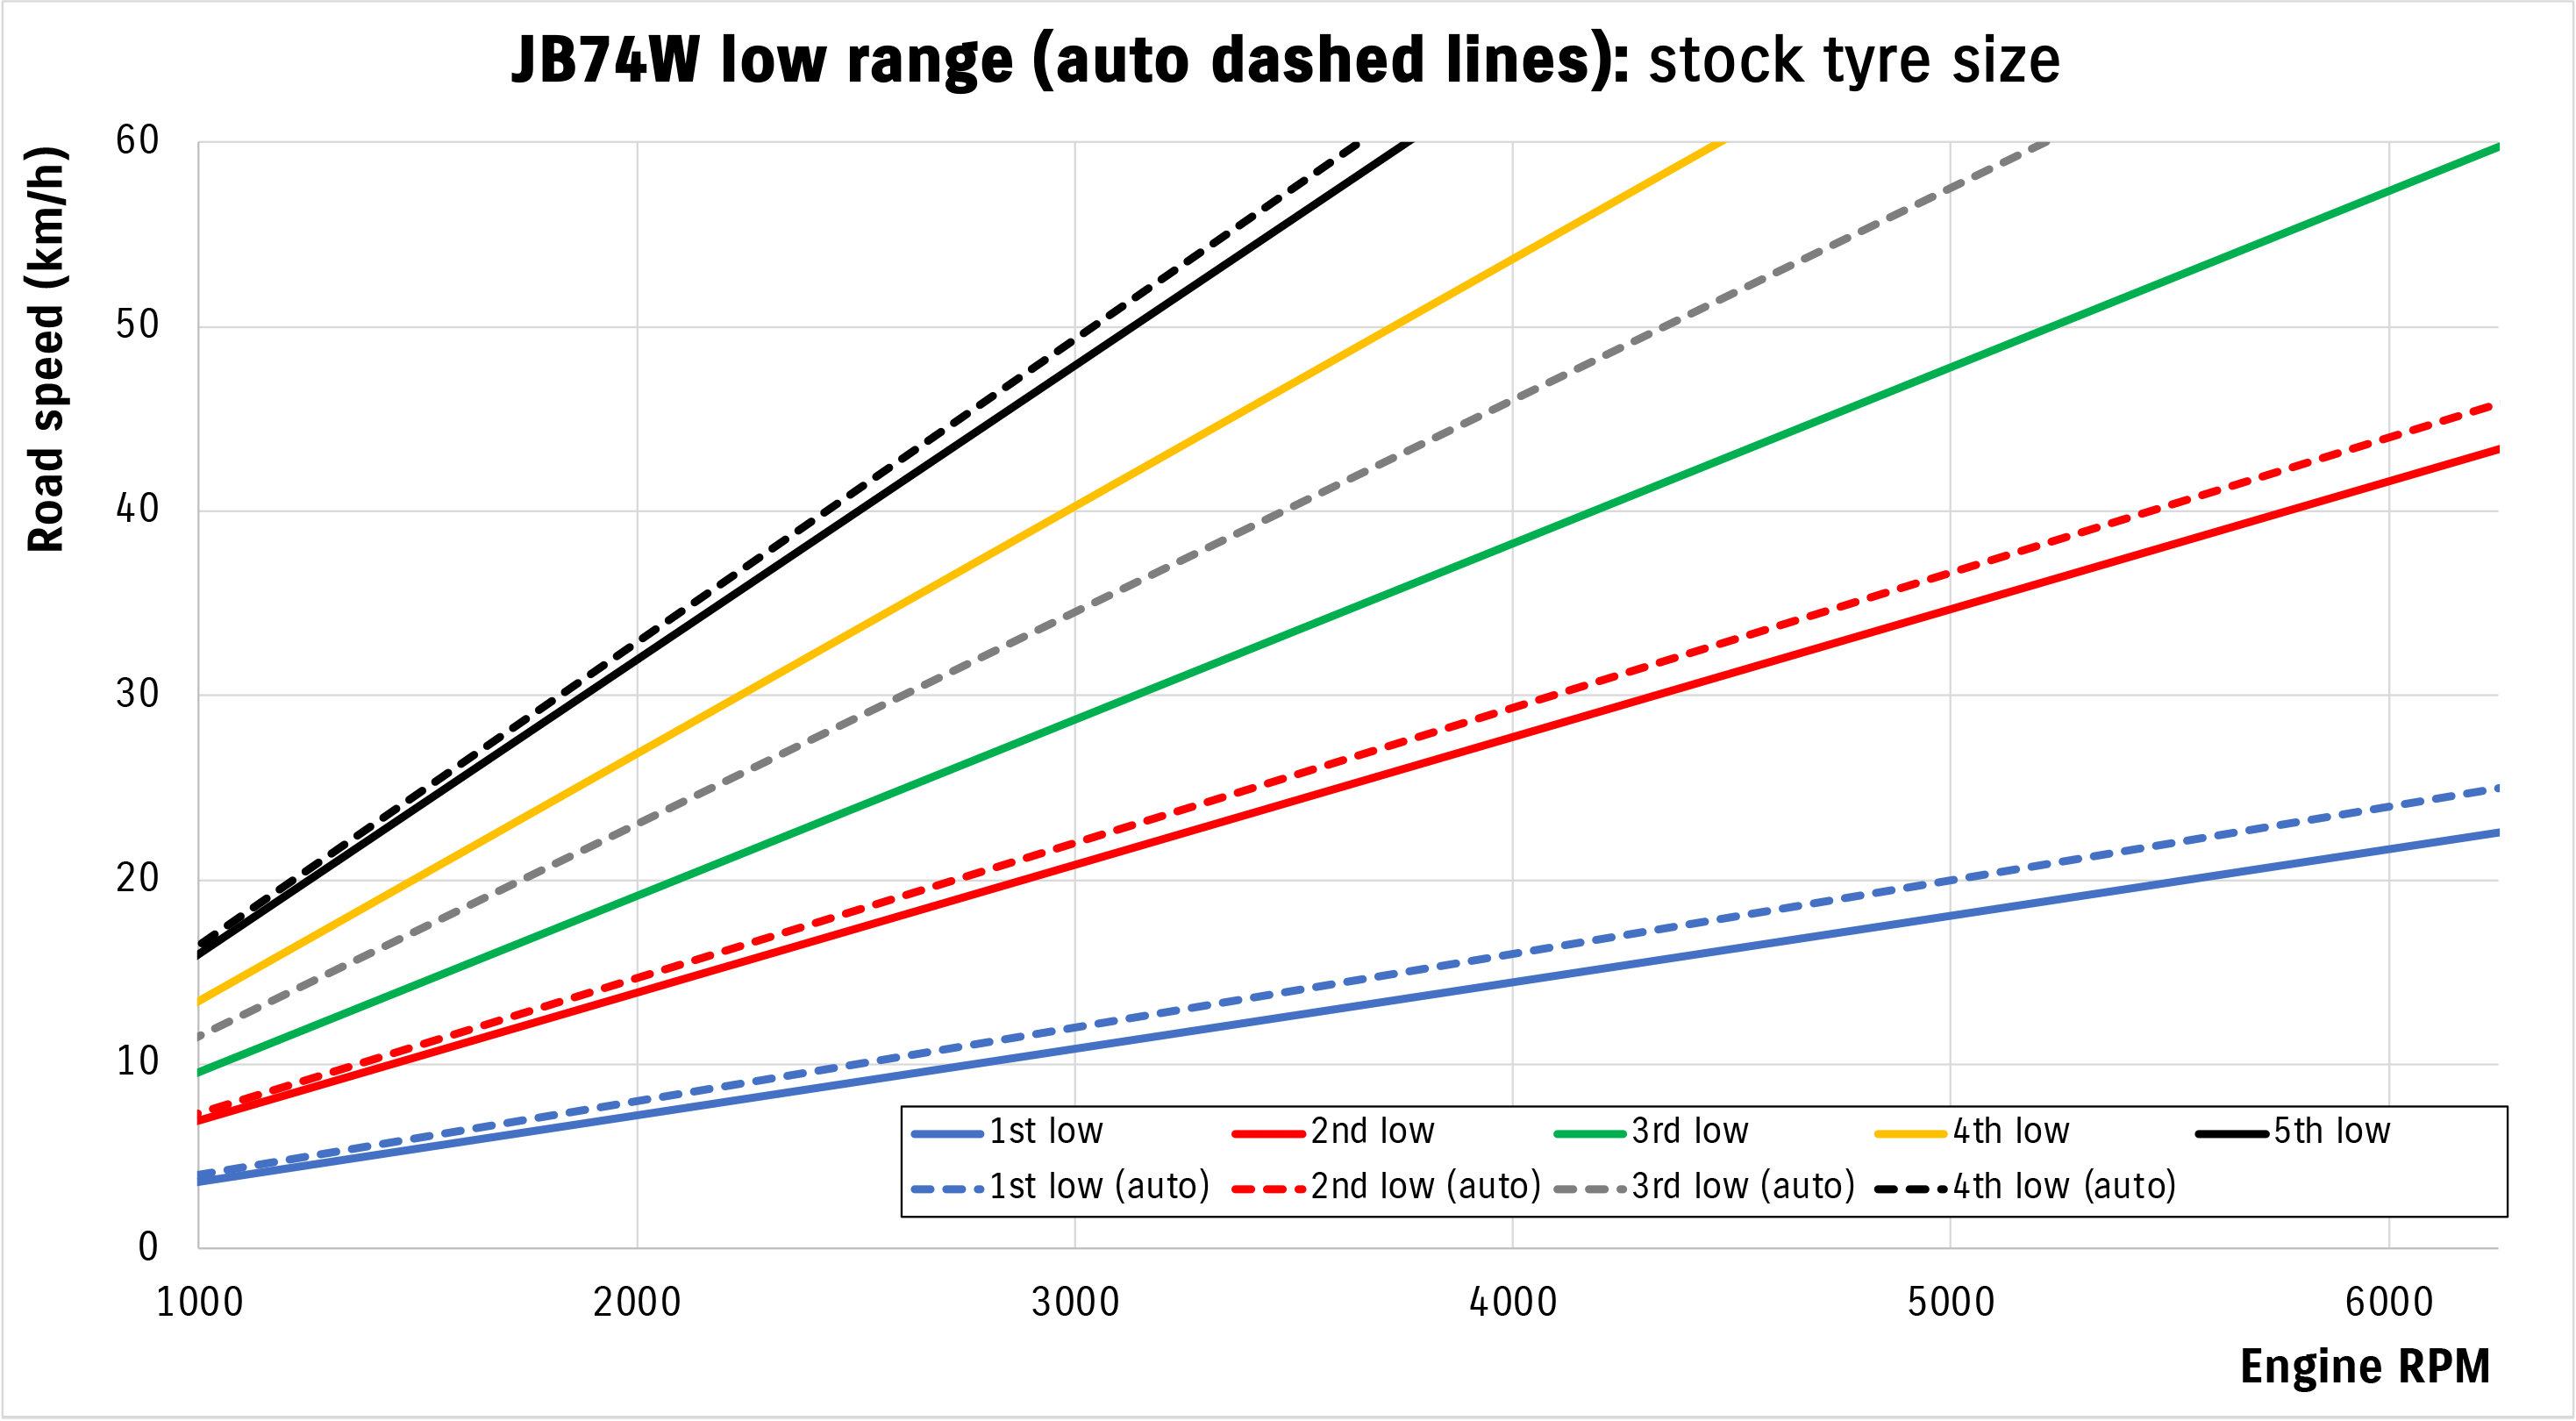
Not much to read into that other than continuing the trend of the manual being marginally shorter both in 1st and also 5th. In addition, practical purposes to sensible speeds offroad 1st through 3rd in the auto (i.e. 4th/overdrive locked out via the switch) and 1st through 4th in the manual are going to be fine in low range. 5th being a direct drive in the manual is a bit of a bonus if you end up ticking along in low range in a slightly quicker section between tricky parts of a track, too.
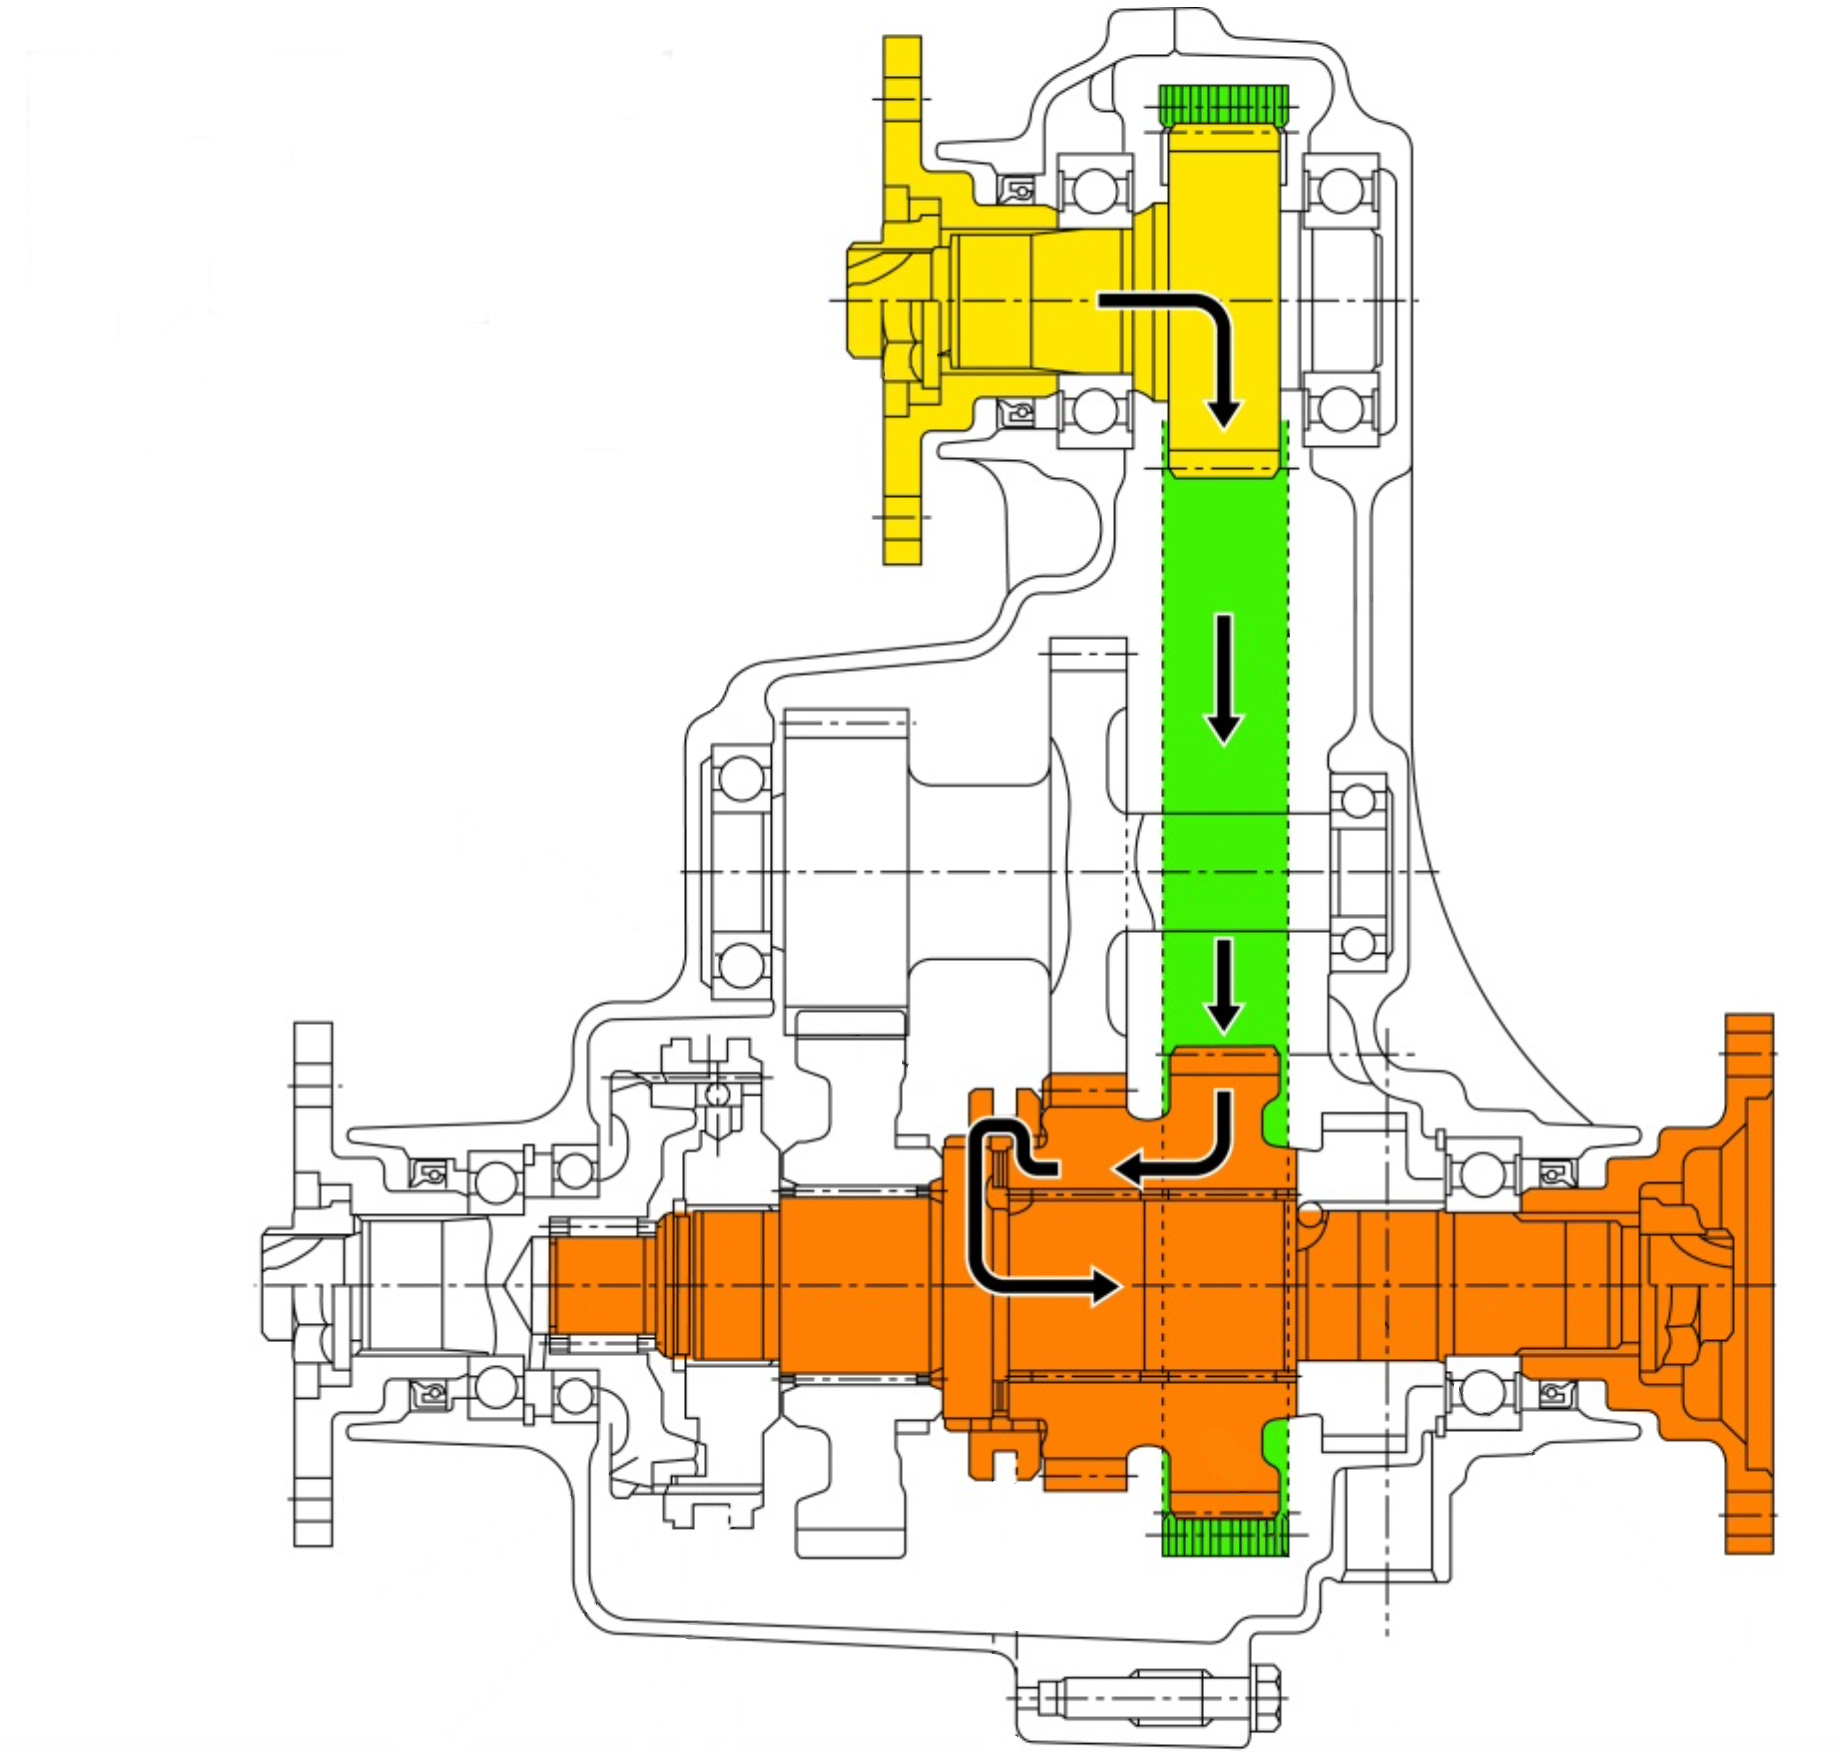
The other question relates to ‘how do you do gear reduction when the high range is direct drive in the manual?’. Well, ultimately while there’s no gear reduction, the drive for all high range goes through the transfer case chain. The power is just directed through an additional set of gears to give you that 2:1 speed reduction in low range.
Changes with larger tyres
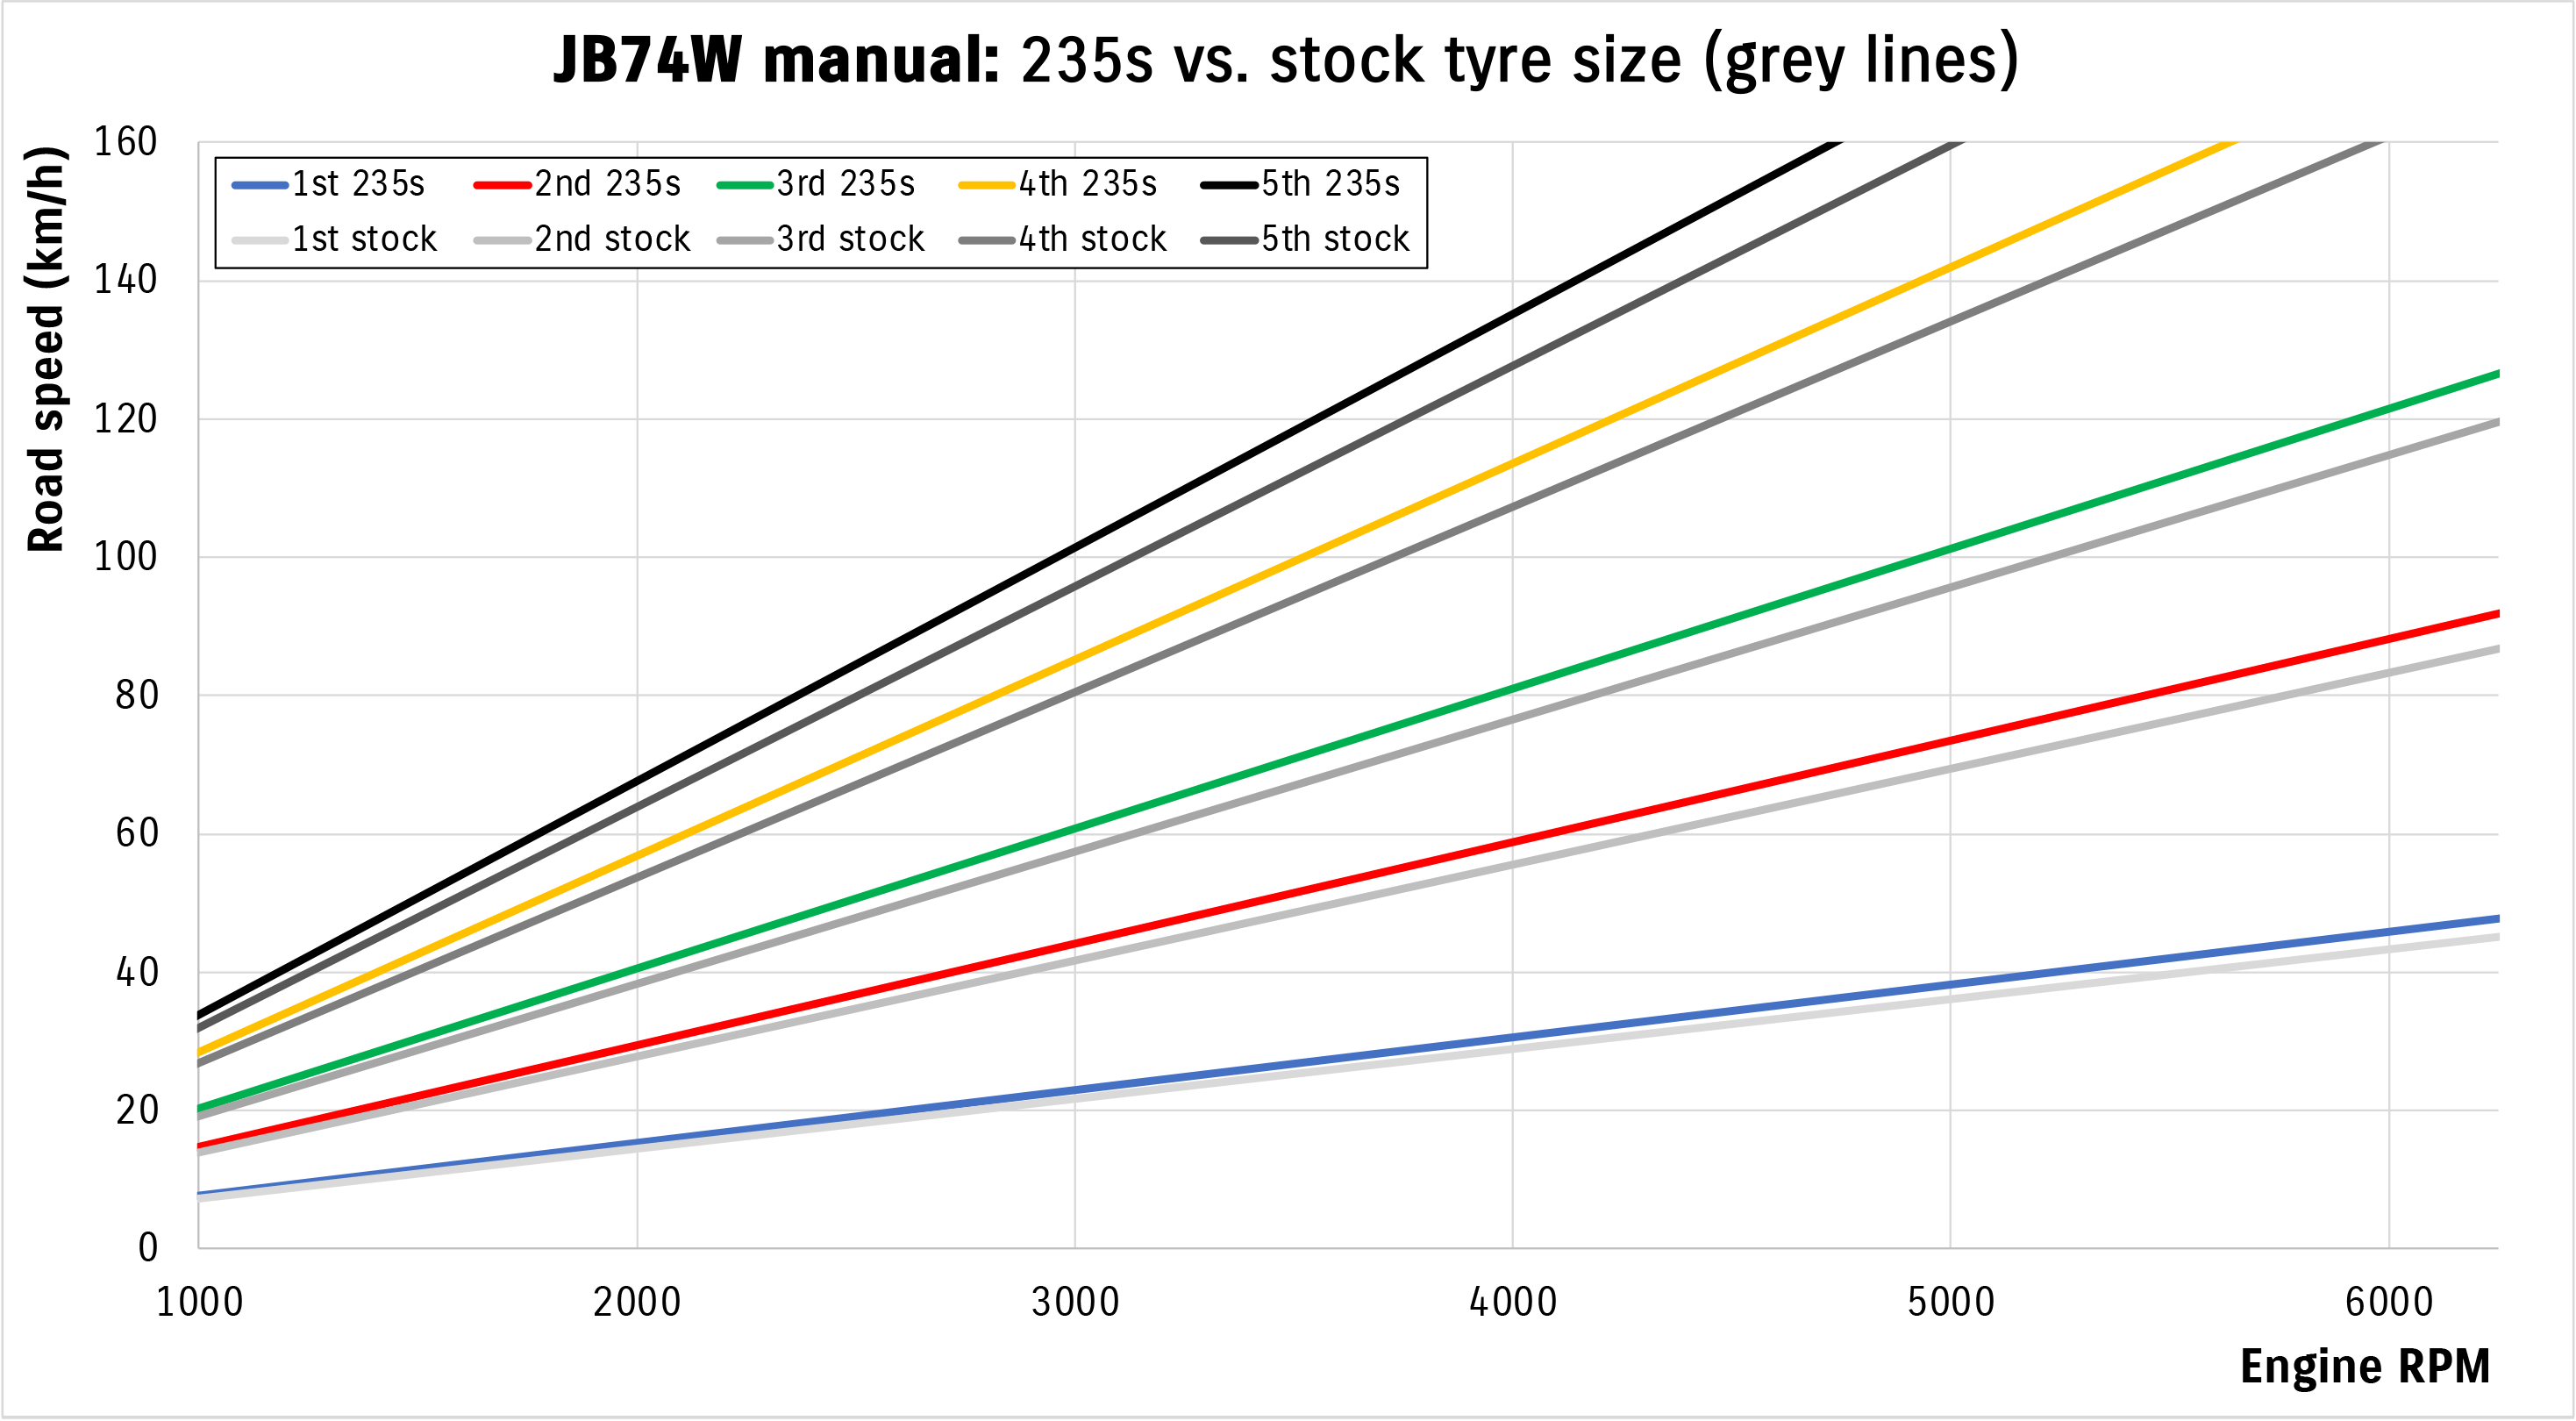
This isn’t unique to a Jimny – the physics of larger tyres works on every car, surprisingly enough – but it’s worth looking at the specifics of how larger tyres change gearing. Here I illustrate the road speed with factory sized tyres (in grey lines) and also 235/75-15 tyres (5.9% different – coloured lines) for a manual:
To illustrate the changes with a few different sizes, here’s a zoom in for 60-120 km/h, 2000-4000 ppm, and only 3rd-4th-5th for a few different tyre sizes but still on a manual.
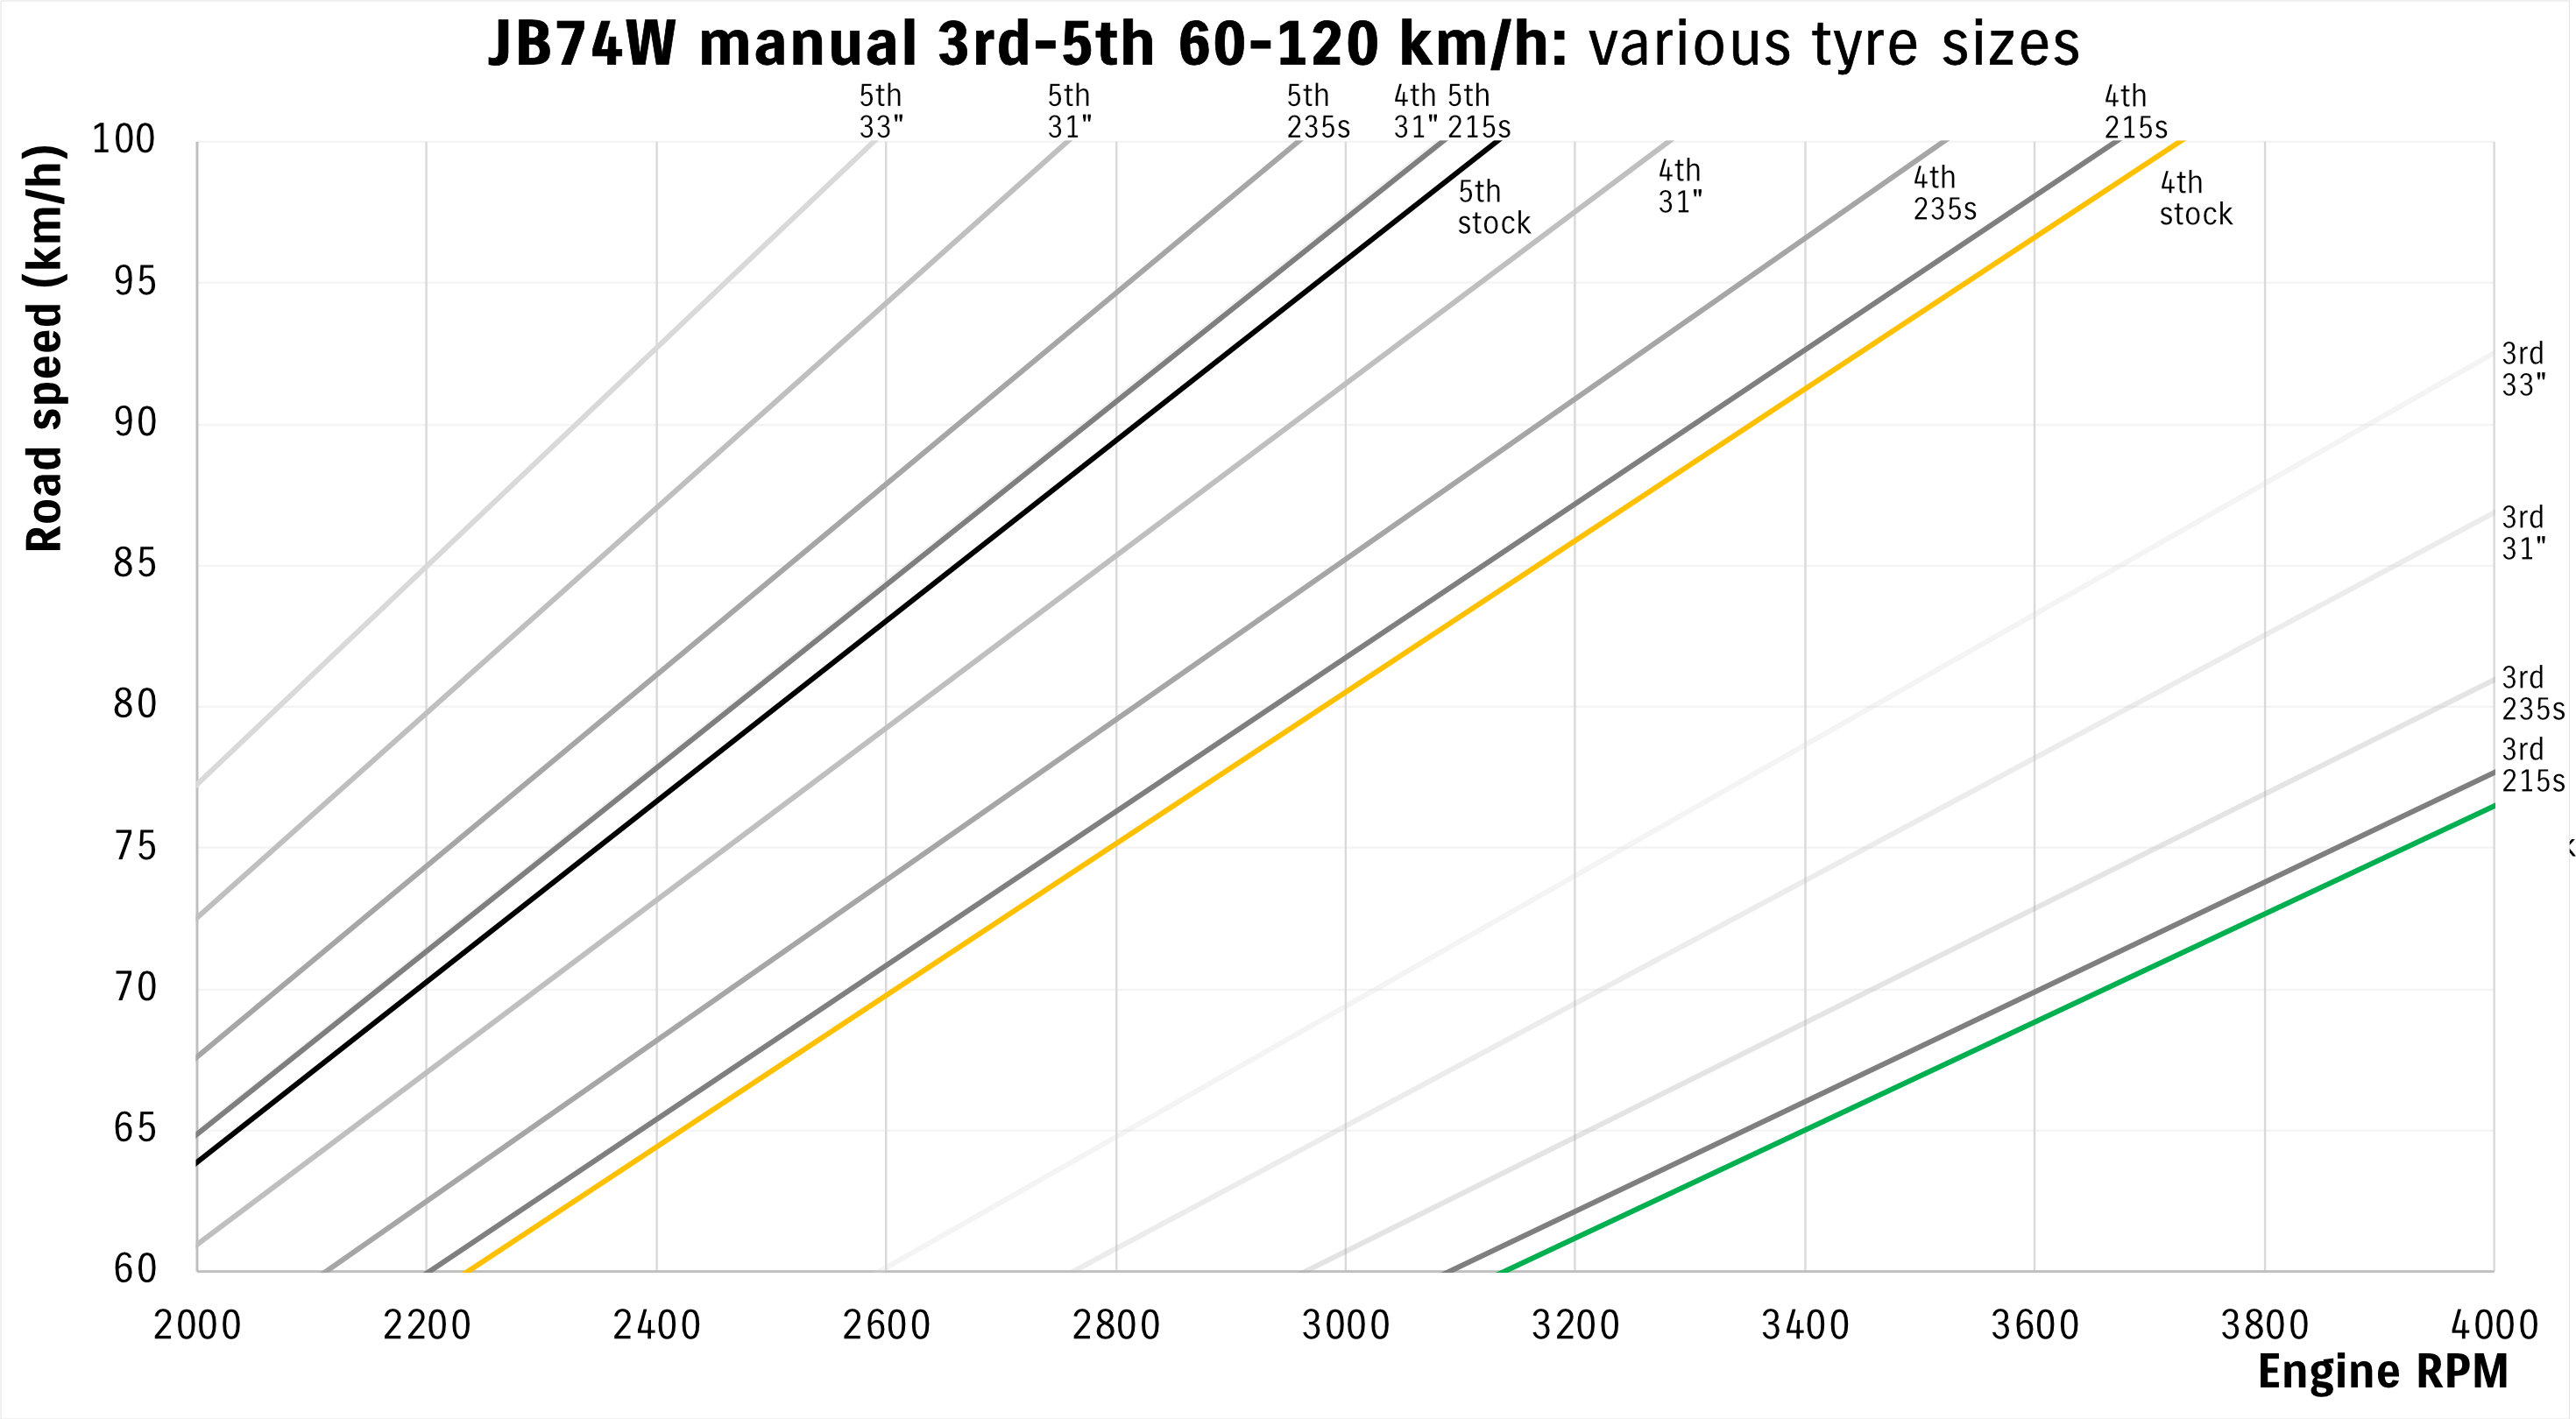
This gets quite hard to visual quickly, but the first thing you’ll notice is that now with 33s 4th gear is where 5th is with the stock car. You think, great! Now I have an extra gear… except you also have shifted the lower gears up, and, it’s not like a Jimny pulls 5th gear with stock tyres that easily anyway. Heavier tyres with a worse overall ratio due to their larger diameter and you’ll be pinging back to 3rd at the smallest incline.
Ultimately the tyre size change effect on gearing/speed in gears is very predictable due to how sizes work. I included the highway speed info and also crawl speeds in my comparison for different tyre sizes. While they do give you lower revs on the highway, you are losing acceleration & the crawl speed offroad is faster for the same revs. This is easiest seen as a table for auto and manual for a few tyre sizes. I look at both what autos and manuals do in terms of revs. Note it doesn’t take into account drag: no way you’re doing 200 km/h in a stock Jimny!
| Stock 195/80-15 | 215/75-15 | 235/75-15 | 31s | 33s | |
|---|---|---|---|---|---|
| Revs @ 110 km/h: 3rd | Manual: 5751 rpm Auto: 4779 rpm | 5666 rpm 4709 rpm | 5431 rpm 4513 rpm | 5063 rpm 4207 rpm | 4757 rpm 3953 rpm |
| 4th | Manual: 4099 rpm Auto: 3331 rpm | 4038 rpm 3282 rpm | 3870 rpm 4513 rpm | 3608 rpm 2933 rpm | 3390 rpm 2756 rpm |
| 5th | Manual: 3444 rpm | 3393 rpm | 3252 rpm | 3032 rpm | 2849 rpm |
| Speed @ 3000 rpm: 3rd | Manual: 57.4 km/h Auto: 69.0 km/h | 58.2 km/h 70.1 km/h | 60.8 km/h 73.1 km/h | 65.2 km/h 78.4 km/h | 69.4 km/h 83.5 km/h |
| 4th | Manual: 80.5 km/h Auto: 99.1 km/h | 81.7 km/h 100.5 km/h | 85.3 km/h 104.9 km/h | 91.5 km/h 112.6 km/h | 97.3 km/h 119.8 km/h |
| 5th | Manual: 95.8 km/h | 97.3 km/h | 101.5 km/h | 108.8 km/h | 115.8 km/h |
| Speed at 4000 rpm: 3rd | Manual: 76.5 km/h Auto: 92.1 km/h | 77.6 km/h 99.4 km/h | 81.0 km/h 97.5 km/h | 86.9 km/h 104.6 km/h | 92.5 km/h 112.3 km/h |
| 4th | Manual: 107.4 km/h Auto: 132.1 km/h | 109.0 km/h 134.1 km/h | 113.7 km/h 139.9 km/h | 122.0 km/h 150.0 km/h | 129.8 km/h 159.7 km/h |
| 5th | Manual: 127.8 km/h | 129.7 km/h | 135.3 km/h | 145.1 km/h | 154.5 km/h |
| Speed at 6250 rpm: 3rd | Manual: 119.5 km/h Auto: 143.8 km/h | 121.3 km/h 146.0 km/h | 126.6 km/h 152.3 km/h | 135.8 km/h 163.4 km/h | 144.5 km/h 173.9 km/h |
| 4th | Manual: 167.7 km/h Auto: 206.4 km/h | 170.3 km/h 209.5 km/h | 177.6 km/h 218.5 km/h | 190.6 km/h 234.4 km/h | 202.8 km/h 249.5 km/h |
| 5th | Manual: 199.6 km/h | 202.6 km/h | 211.4 km/h | 226.8 km/h | 241.3 km/h |
Highway oomph
The thing about this is people will think “oh, that’s great, dropping the rpm on the highway means better economy as the engine isn’t screaming its head off”. The problem is that you have to load the engine up more as different revs mean different torque available, and that torque is then given less multiplication by the longer gearing that bigger tyres give you. I’ve gone through and worked out what torque the engine makes (at full throttle) at each rpm for 110 km/h for different tyre sizes. You then work out how that translates into the apparent thrust force at 110 km/h for each tyre size. This following table illustrates the actual oomph provided at 110 km/h for both auto and manual for bigger tyres.
| Stock | 215s | 235s | 31s | 33s | |
|---|---|---|---|---|---|
| rpm @ 110 km/h manual, auto | Manual: 3444 rpm Auto: 3331 rpm | 3393 rpm 3282 rpm | 3252 rpm 3146 rpm | 3032 rpm 2933 rpm | 2849 rpm 2756 rpm |
| Torque @ 110 km/h | Manual: 132 Nm Auto: 131 Nm | 132 Nm 130 Nm | 129 Nm 126 Nm | 119 Nm 111 Nm | 103 Nm 94 Nm |
| Thrust @ 110 km/h | Manual: 1558 N Auto: 1496 N | 1534 N 1461 N | 1438 N 1358 N | 1237 N 1116 N | 1005 N 888 N |
As you can see the thrust dropoff is faster than the rpm drop. Going to 33s is ‘only’ 21% gearing change, but you’ve lost 50% of the available force for acceleration due to both the rpm dropoff and the longer gearing giving less torque multiplication. This becomes more apparent if you graph the apparent thrust versus engine rpm for 110 km/h with different tyre options.
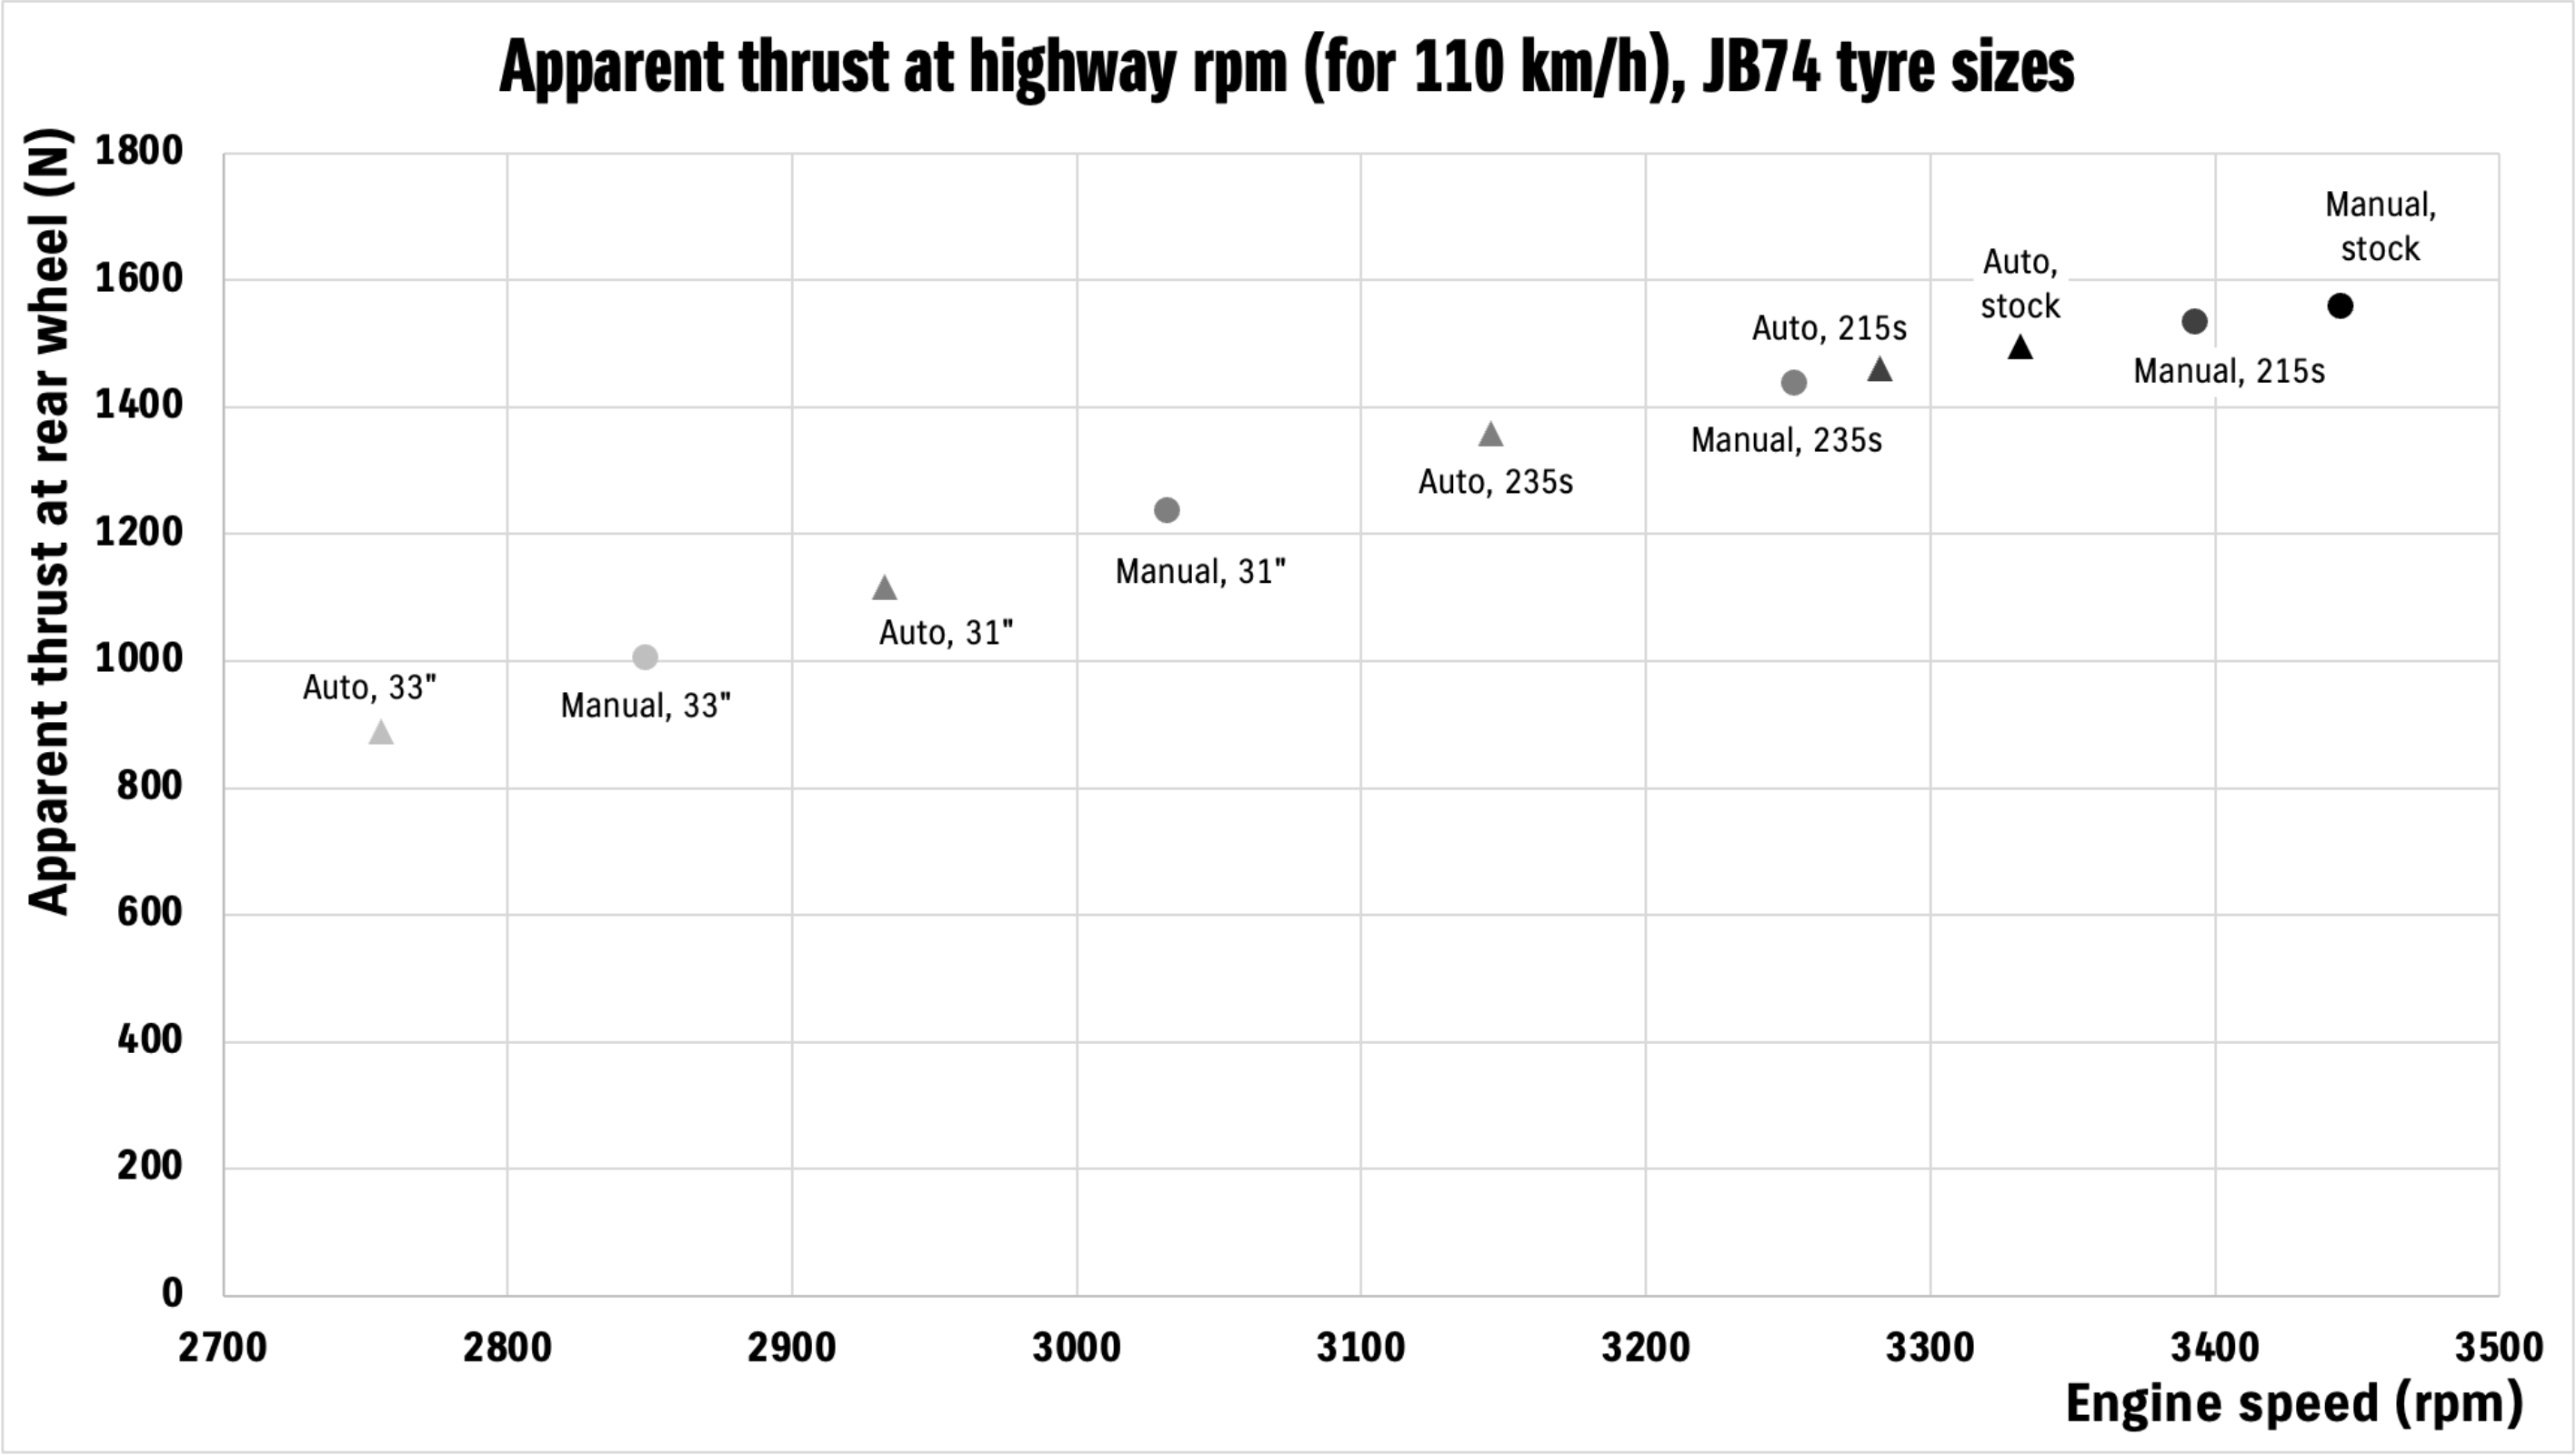
Once you’re into seriously big tyre territory – and I’d class anything over a 29″ tyre on a Jimny as getting there – you need to think about fixing up the gearing to start to help out with things like crawl speed and not having to go back several gears just to get up a minor incline on the highway.
Reduction gearing
With big tyres you’ve got the big tradeoff introduced in the last section: While you’ve gained clearance, your crawl speed is higher and you have less acceleration at your disposal. You’ve also dropped out of the optimum torque range on the highway, making it feel quite sluggish at touring speeds.
There are a number of gear sets available, but the common ones for a JB74 are as follows:
Manual
(stock ratios are 1:1 and 2:1 for high and low range)
- 0% high reduction, 70% low reduction (Protrack)
- 7% high, 77% low (Protrack)
- 17% high, 87% low (Protrack)
- 0% high, 77% low/1:1, 3.56:1 ratios (Sumo)
- 17% high, 17% low/1.17:1, 2.35:1 ratios (Sumo)
- 17% high, 108% low/1.17:1, 4.17:1 (Sumo)
Automatic
(stock ratios are 1.32:1 and 2.64:1 for high and low range)
- 15% high, 85% low (Protrack)
- 0% high, 77% low (Sumo)
- 15% high, 15% low (Sumo)
- 15% high, 105% low (Sumo)
The problem here is everyone wants to see every possible gear and tyre combination, and it’s a bit hard to depict that on one graph. I’m also way too lazy to write a plugin for this website to allow you to mix and match gear ratios.
For basic advice: for high range reduction 7% change is good for accounting for 29″ tyres to put them back to where the car is stock (or thereabouts) and 15/17% is well suited for 31″ tyres. The car benefits from sitting at rpm on the highway roughly where it does stock; even a small tyre size change as shown earlier really dramatically cuts back on available force to accelerate you on the highway.
For low range reduction it’s a bit harder to simplify down to basic advice given tyre size changes. Even standard tyre cars benefit from being able to crawl slowly, especially manuals. Deep reductions just give you further options, although the harder you are on the car the more you might hit issues with axles (since you’re multiplying torque further).
To get past how difficult it is to visualise all possible reduction combinations we’ll just look at some key differences, first off high range reduction given two common tyre size changes (29″ or 235/75-15, and also 31″ tyres) against stock, and then low range reduction in 1st and 2nd gear for the same tyre size changes against stock.
High range reductions
Manual
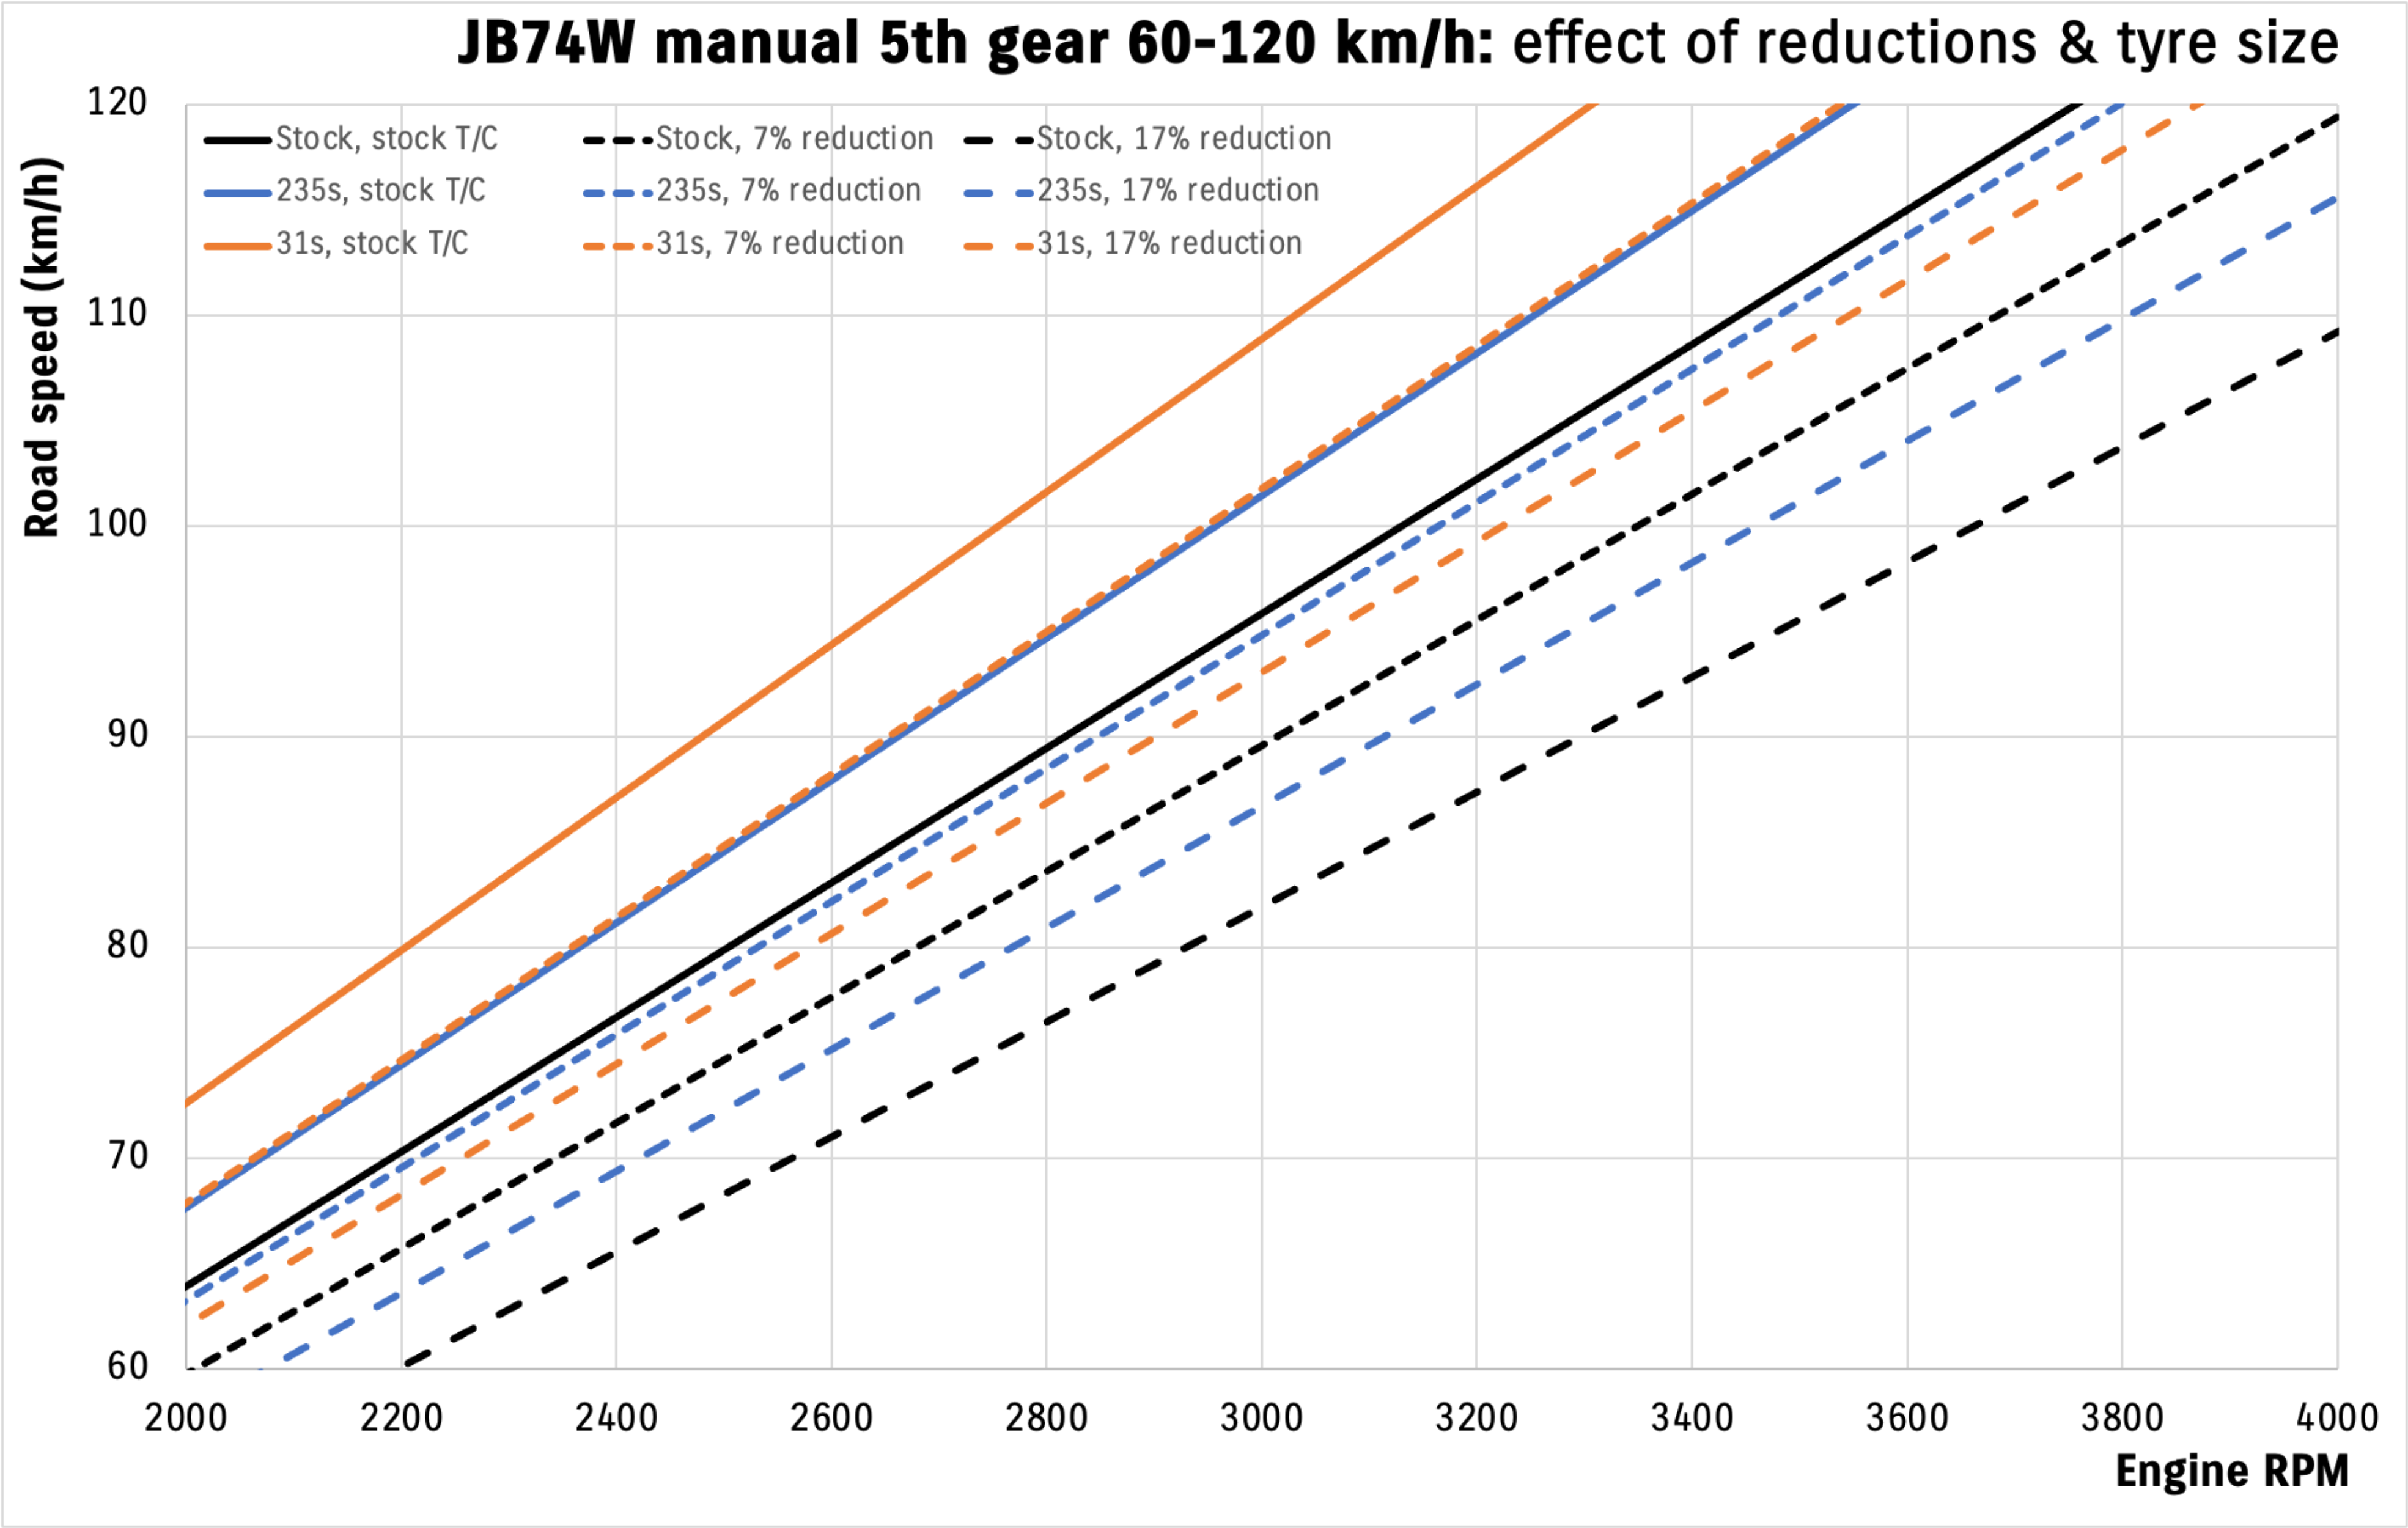
Not much to say here other than it’s what you expect: 7% reduction puts 235s basically at stock tyre size (a teeny few more rpm, but nothing hugely important), 17% reduction on 31s a bit more again; note that 7% reduction on a set of 31s put it exactly where you end up with 235s with a stock transfer case.
Automatic
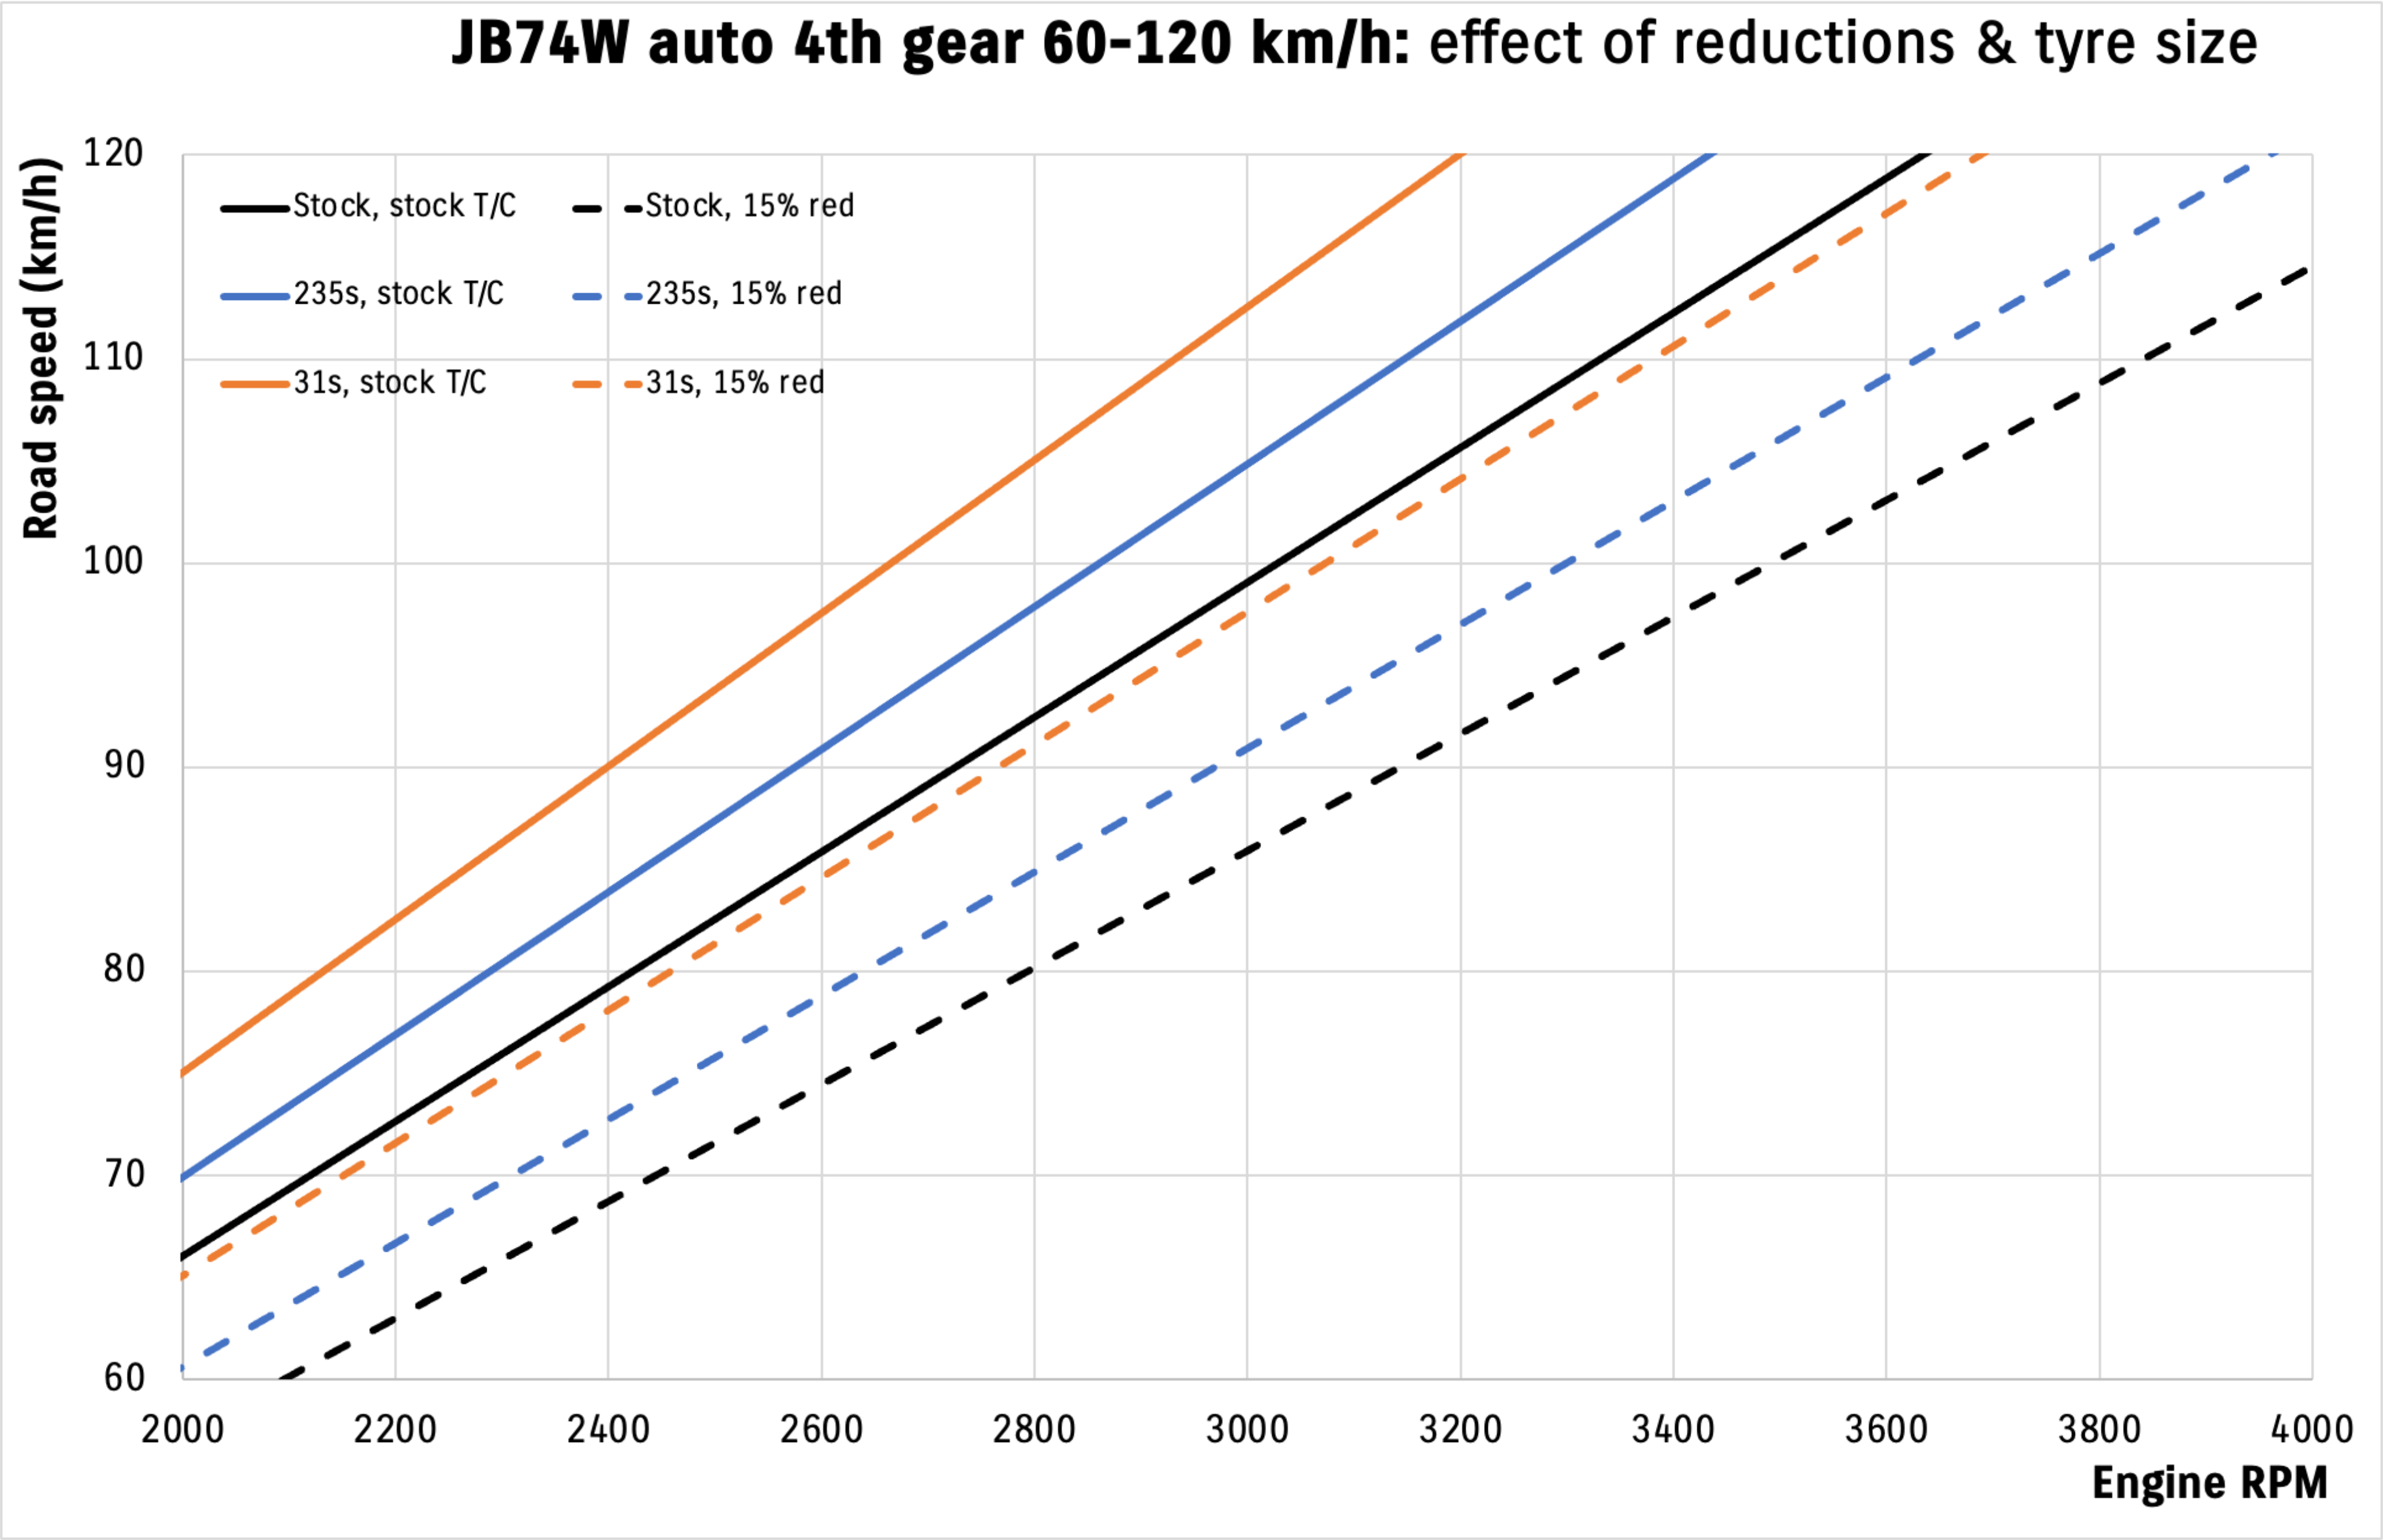
Fewer options means even less to say here. Even with 235s a 15% reduction gearing in high range isn’t horrendous for rpm at highway speeds, and it’ll probably get better economy by having access to more torque even though it’ll be revving more (just over 3200 rpm, instead of just over 3000 rpm @ 100 km/h).
Low range reductions
These are a lot messier so I’ve done one graph per tyre size: stock, 235s, and 31s. For the 235s and 31″ graphs I’ve also drawn on two grey lines for stock tyre size 1st and 2nd gear low range with stock transfer case for comparison to the gearing as delivered from the factory.
Manual
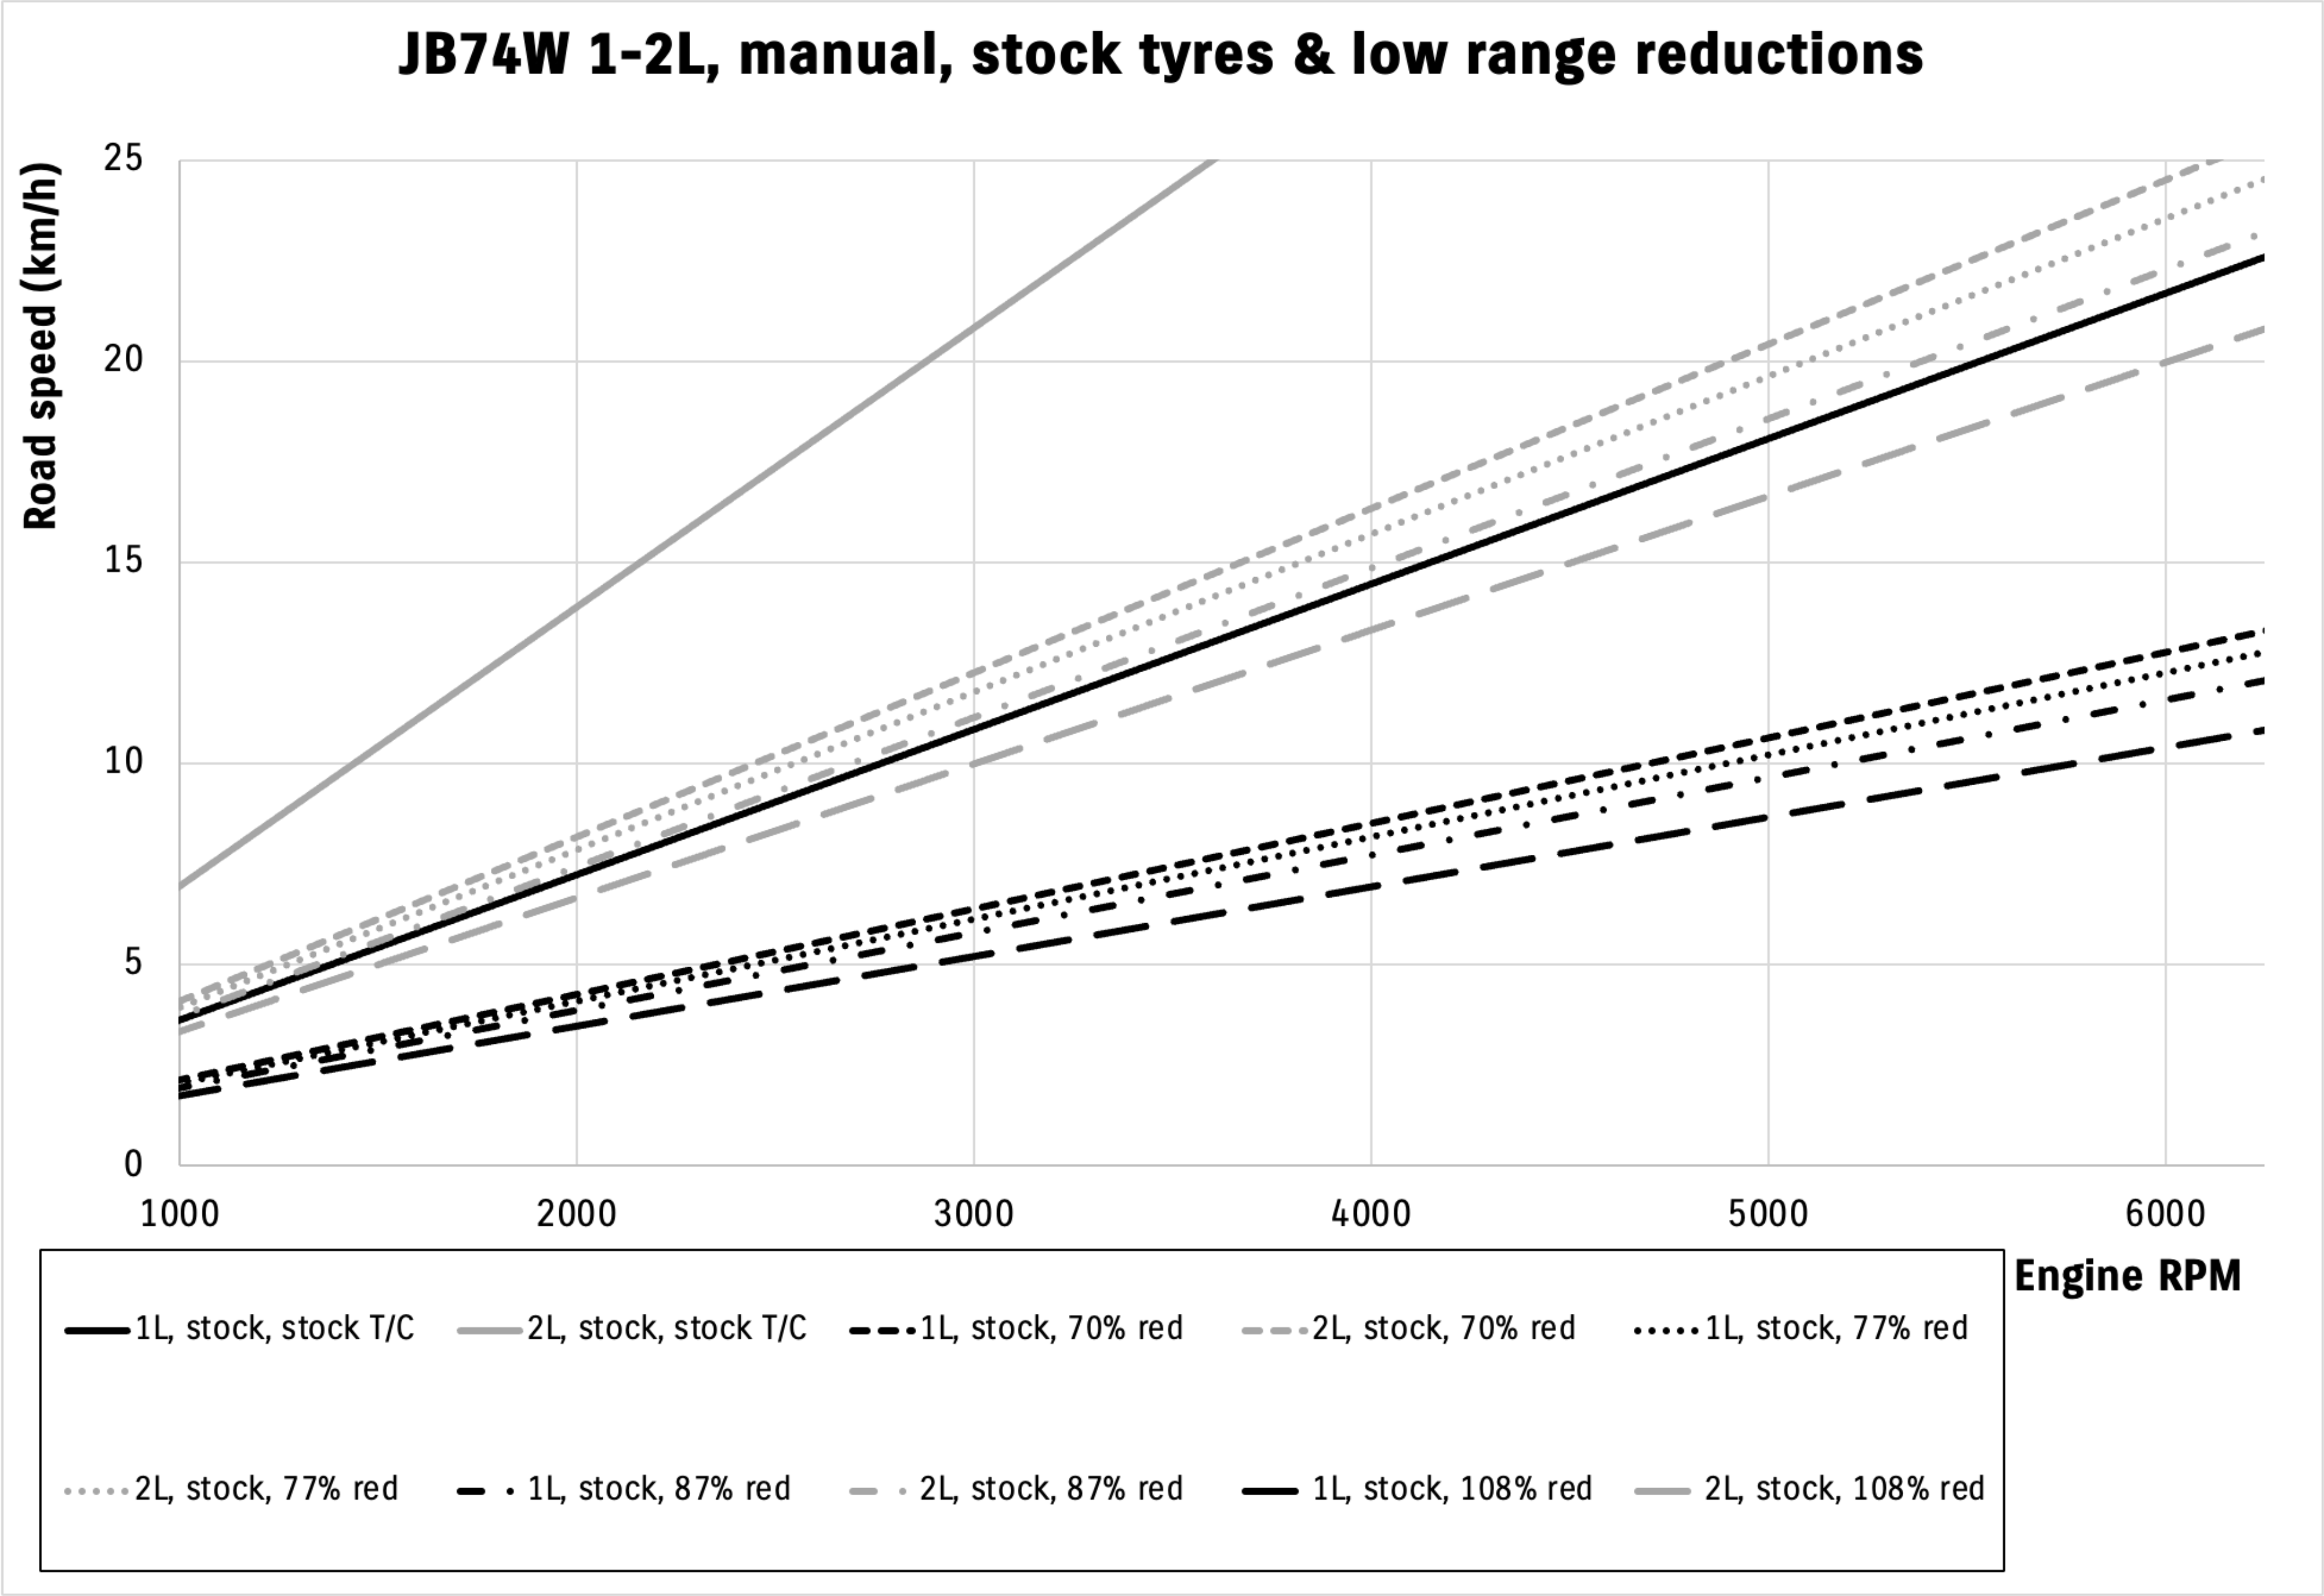
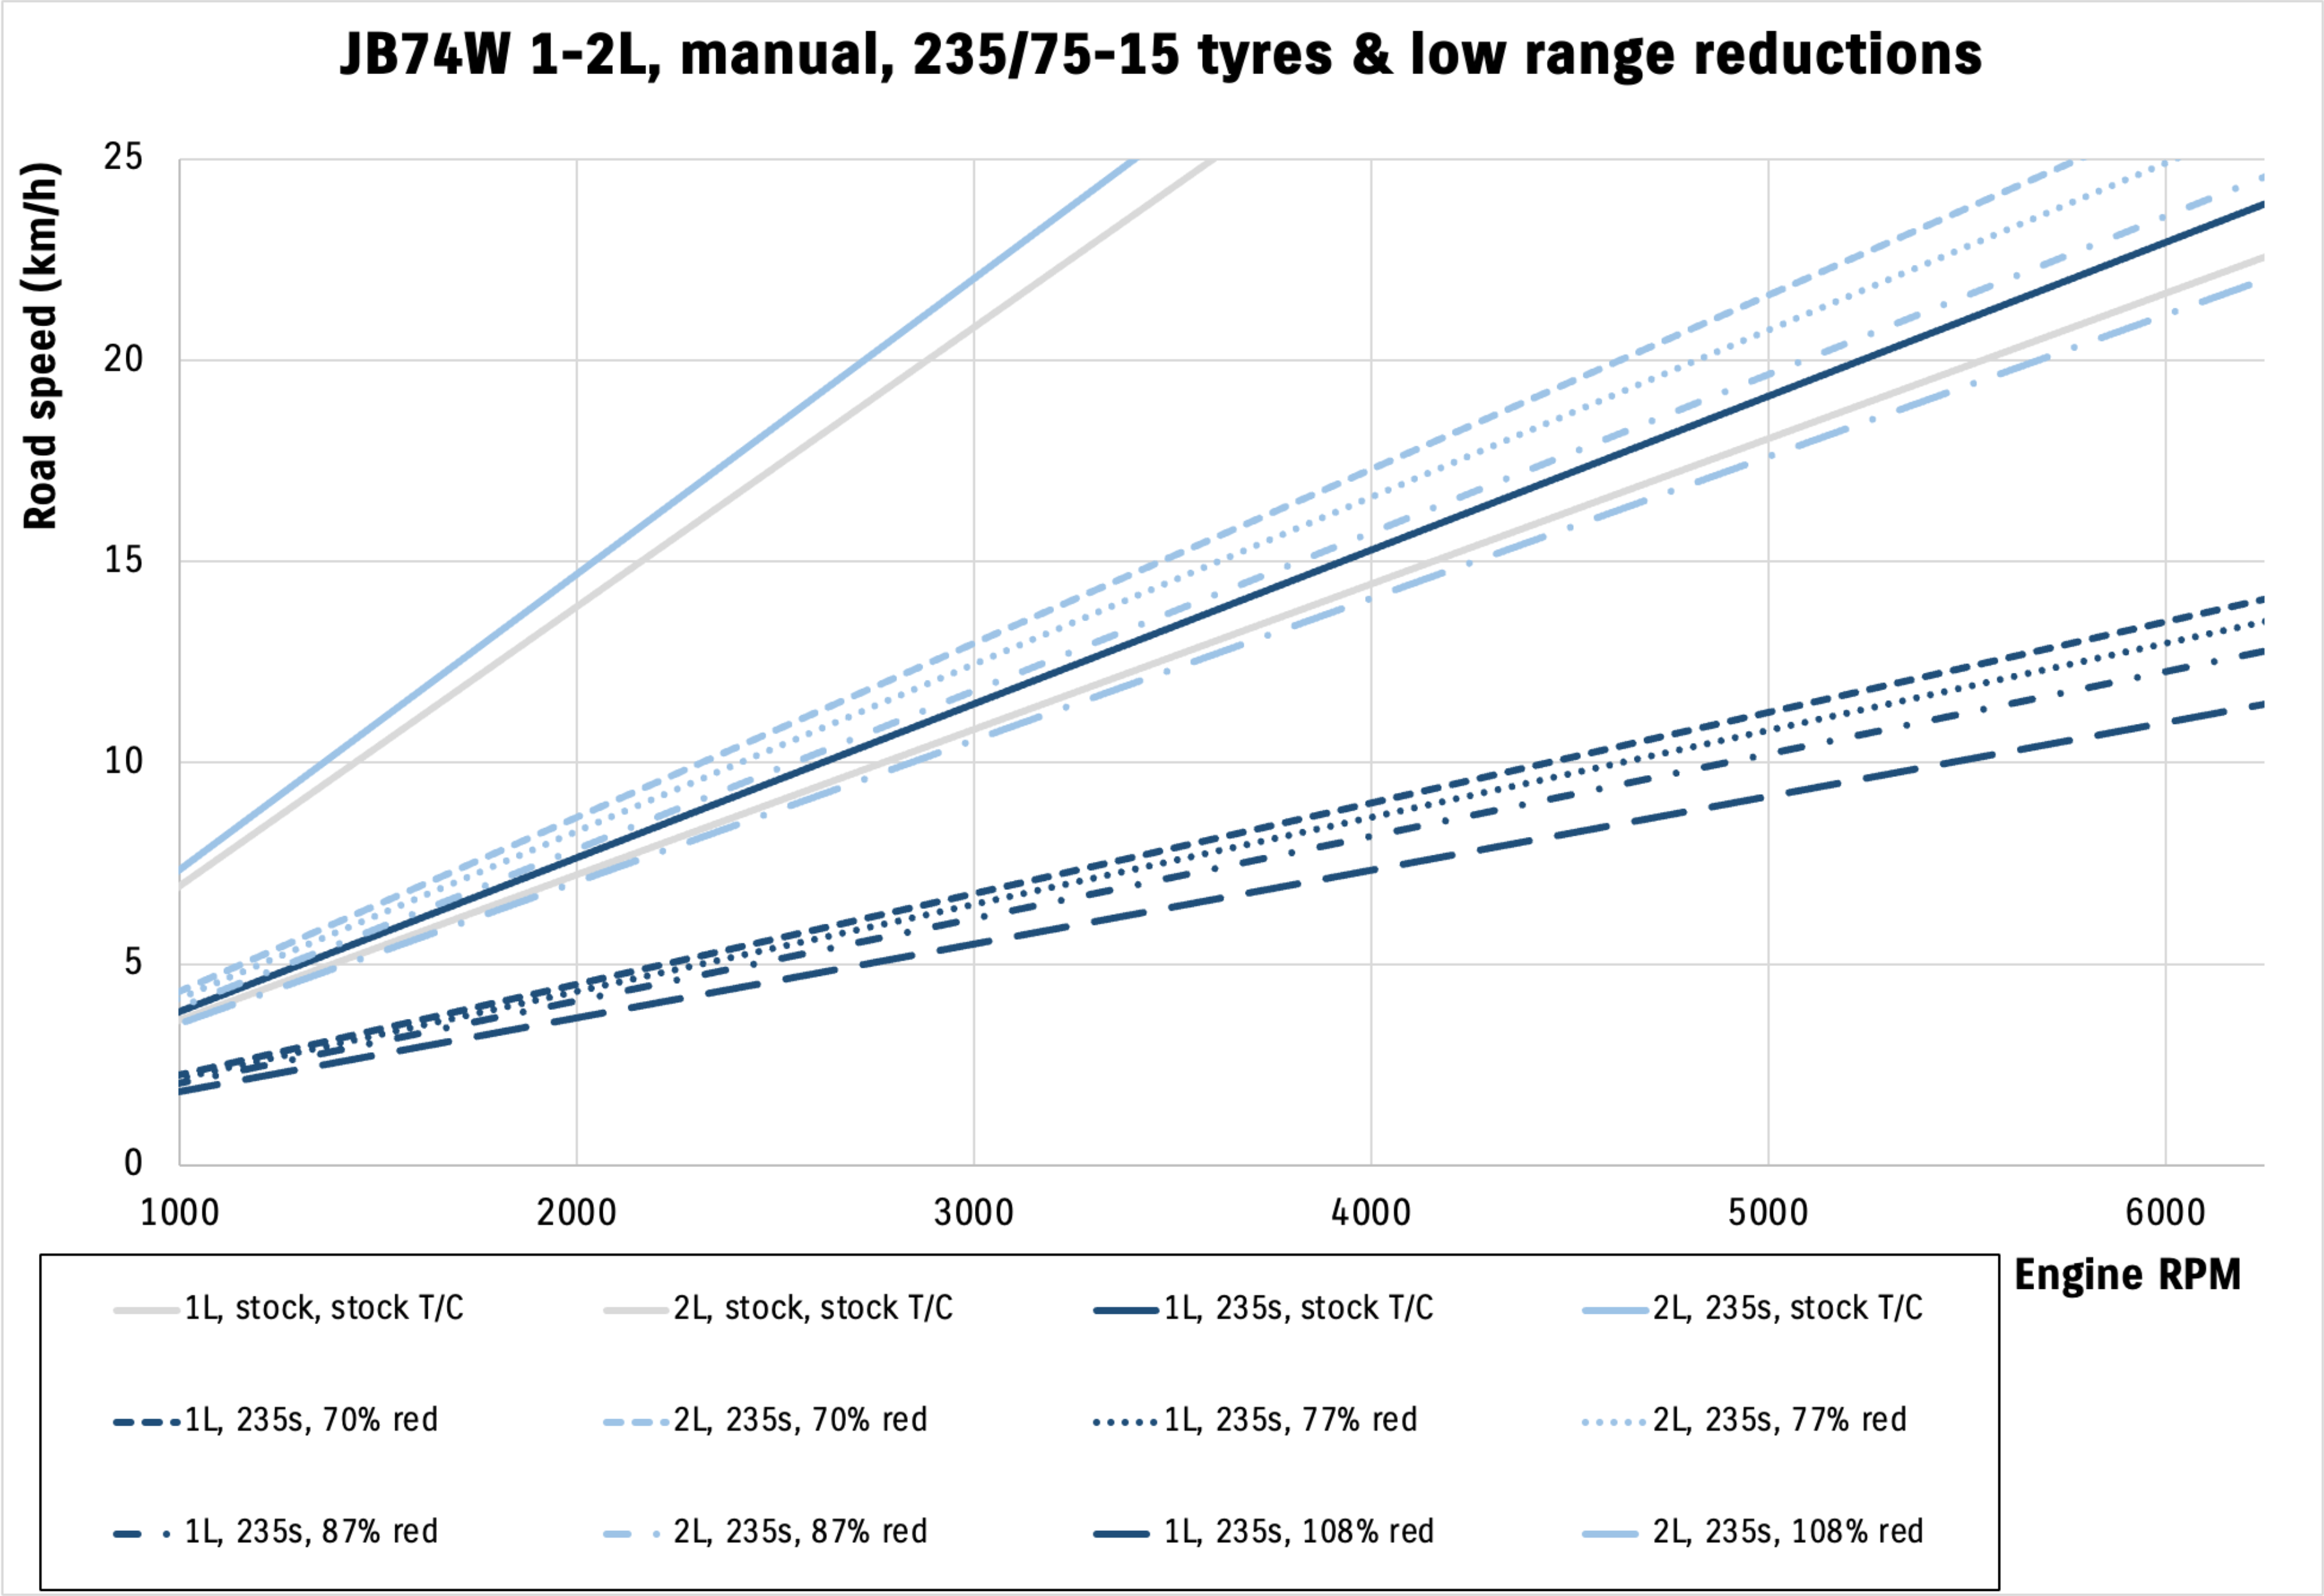
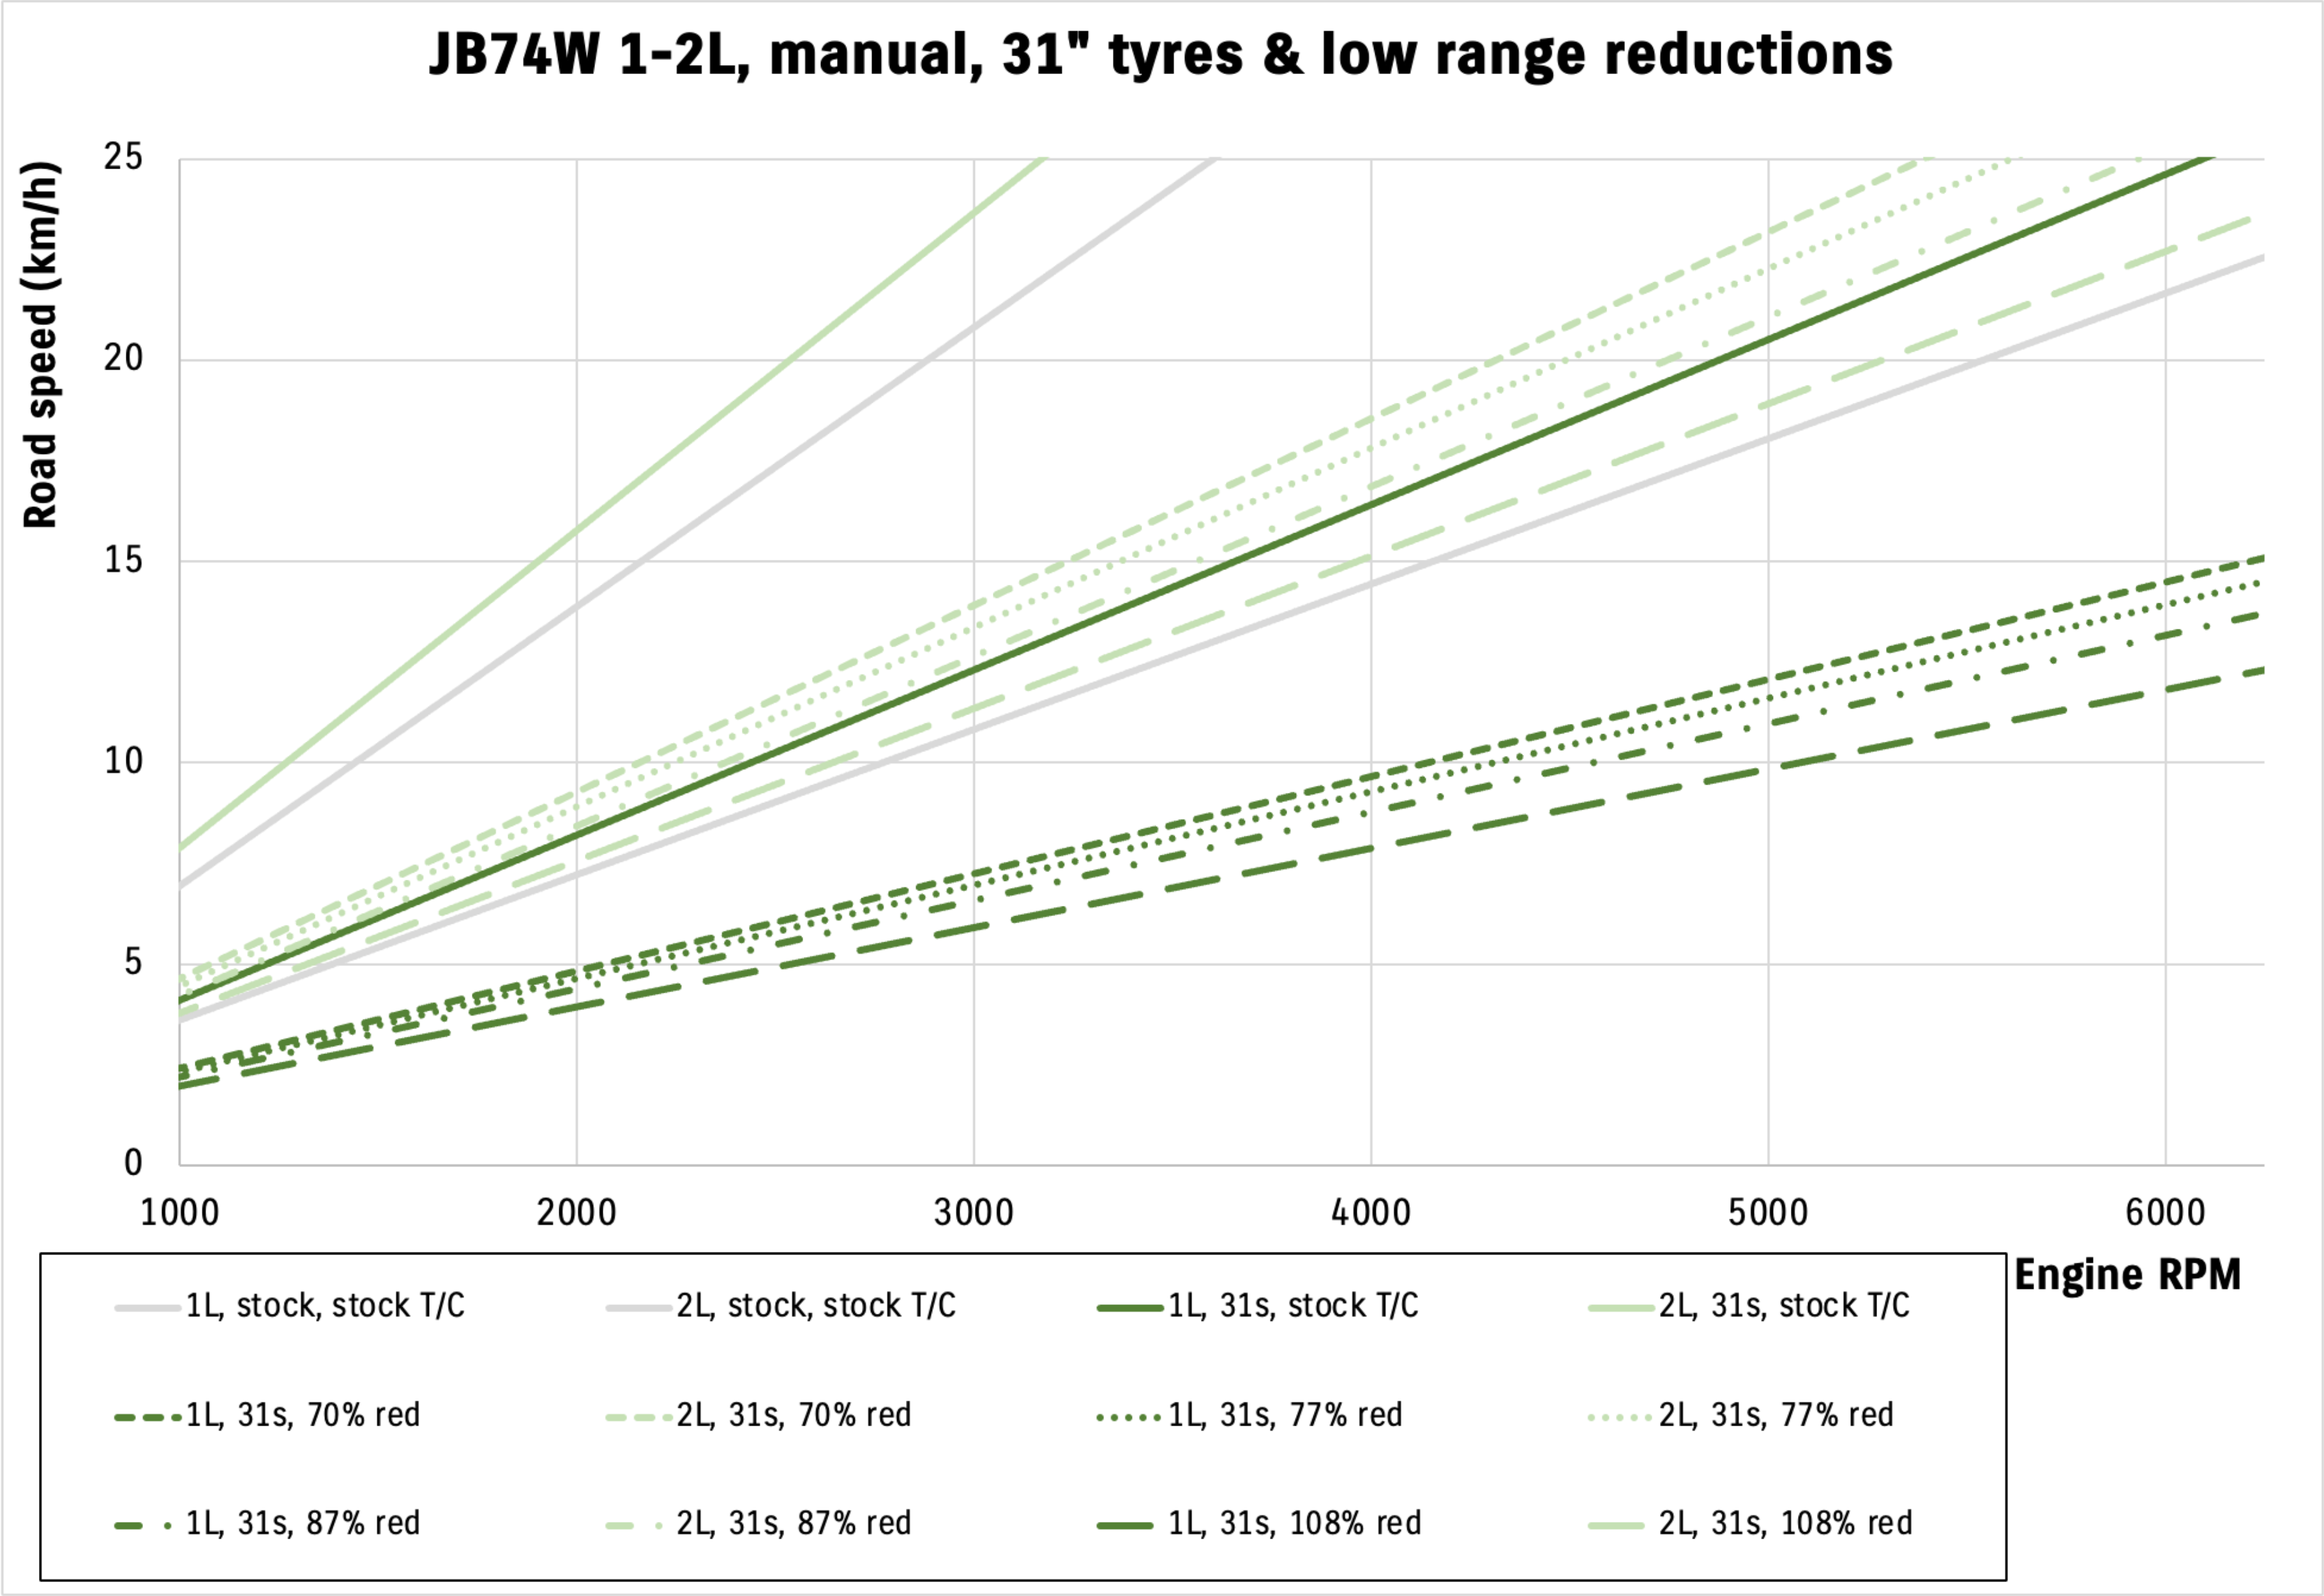
The big takeaway from all of these is how it you end up with that extra low first gear; 2nd gear low range is basically where your first gear low range is standard. This is a good thing for flexibility and having that additional option for crawling offroad.
No good if you want to do 60 km/h at the beach in low range though to run a deep, deep reduction like 108% though.
Automatic
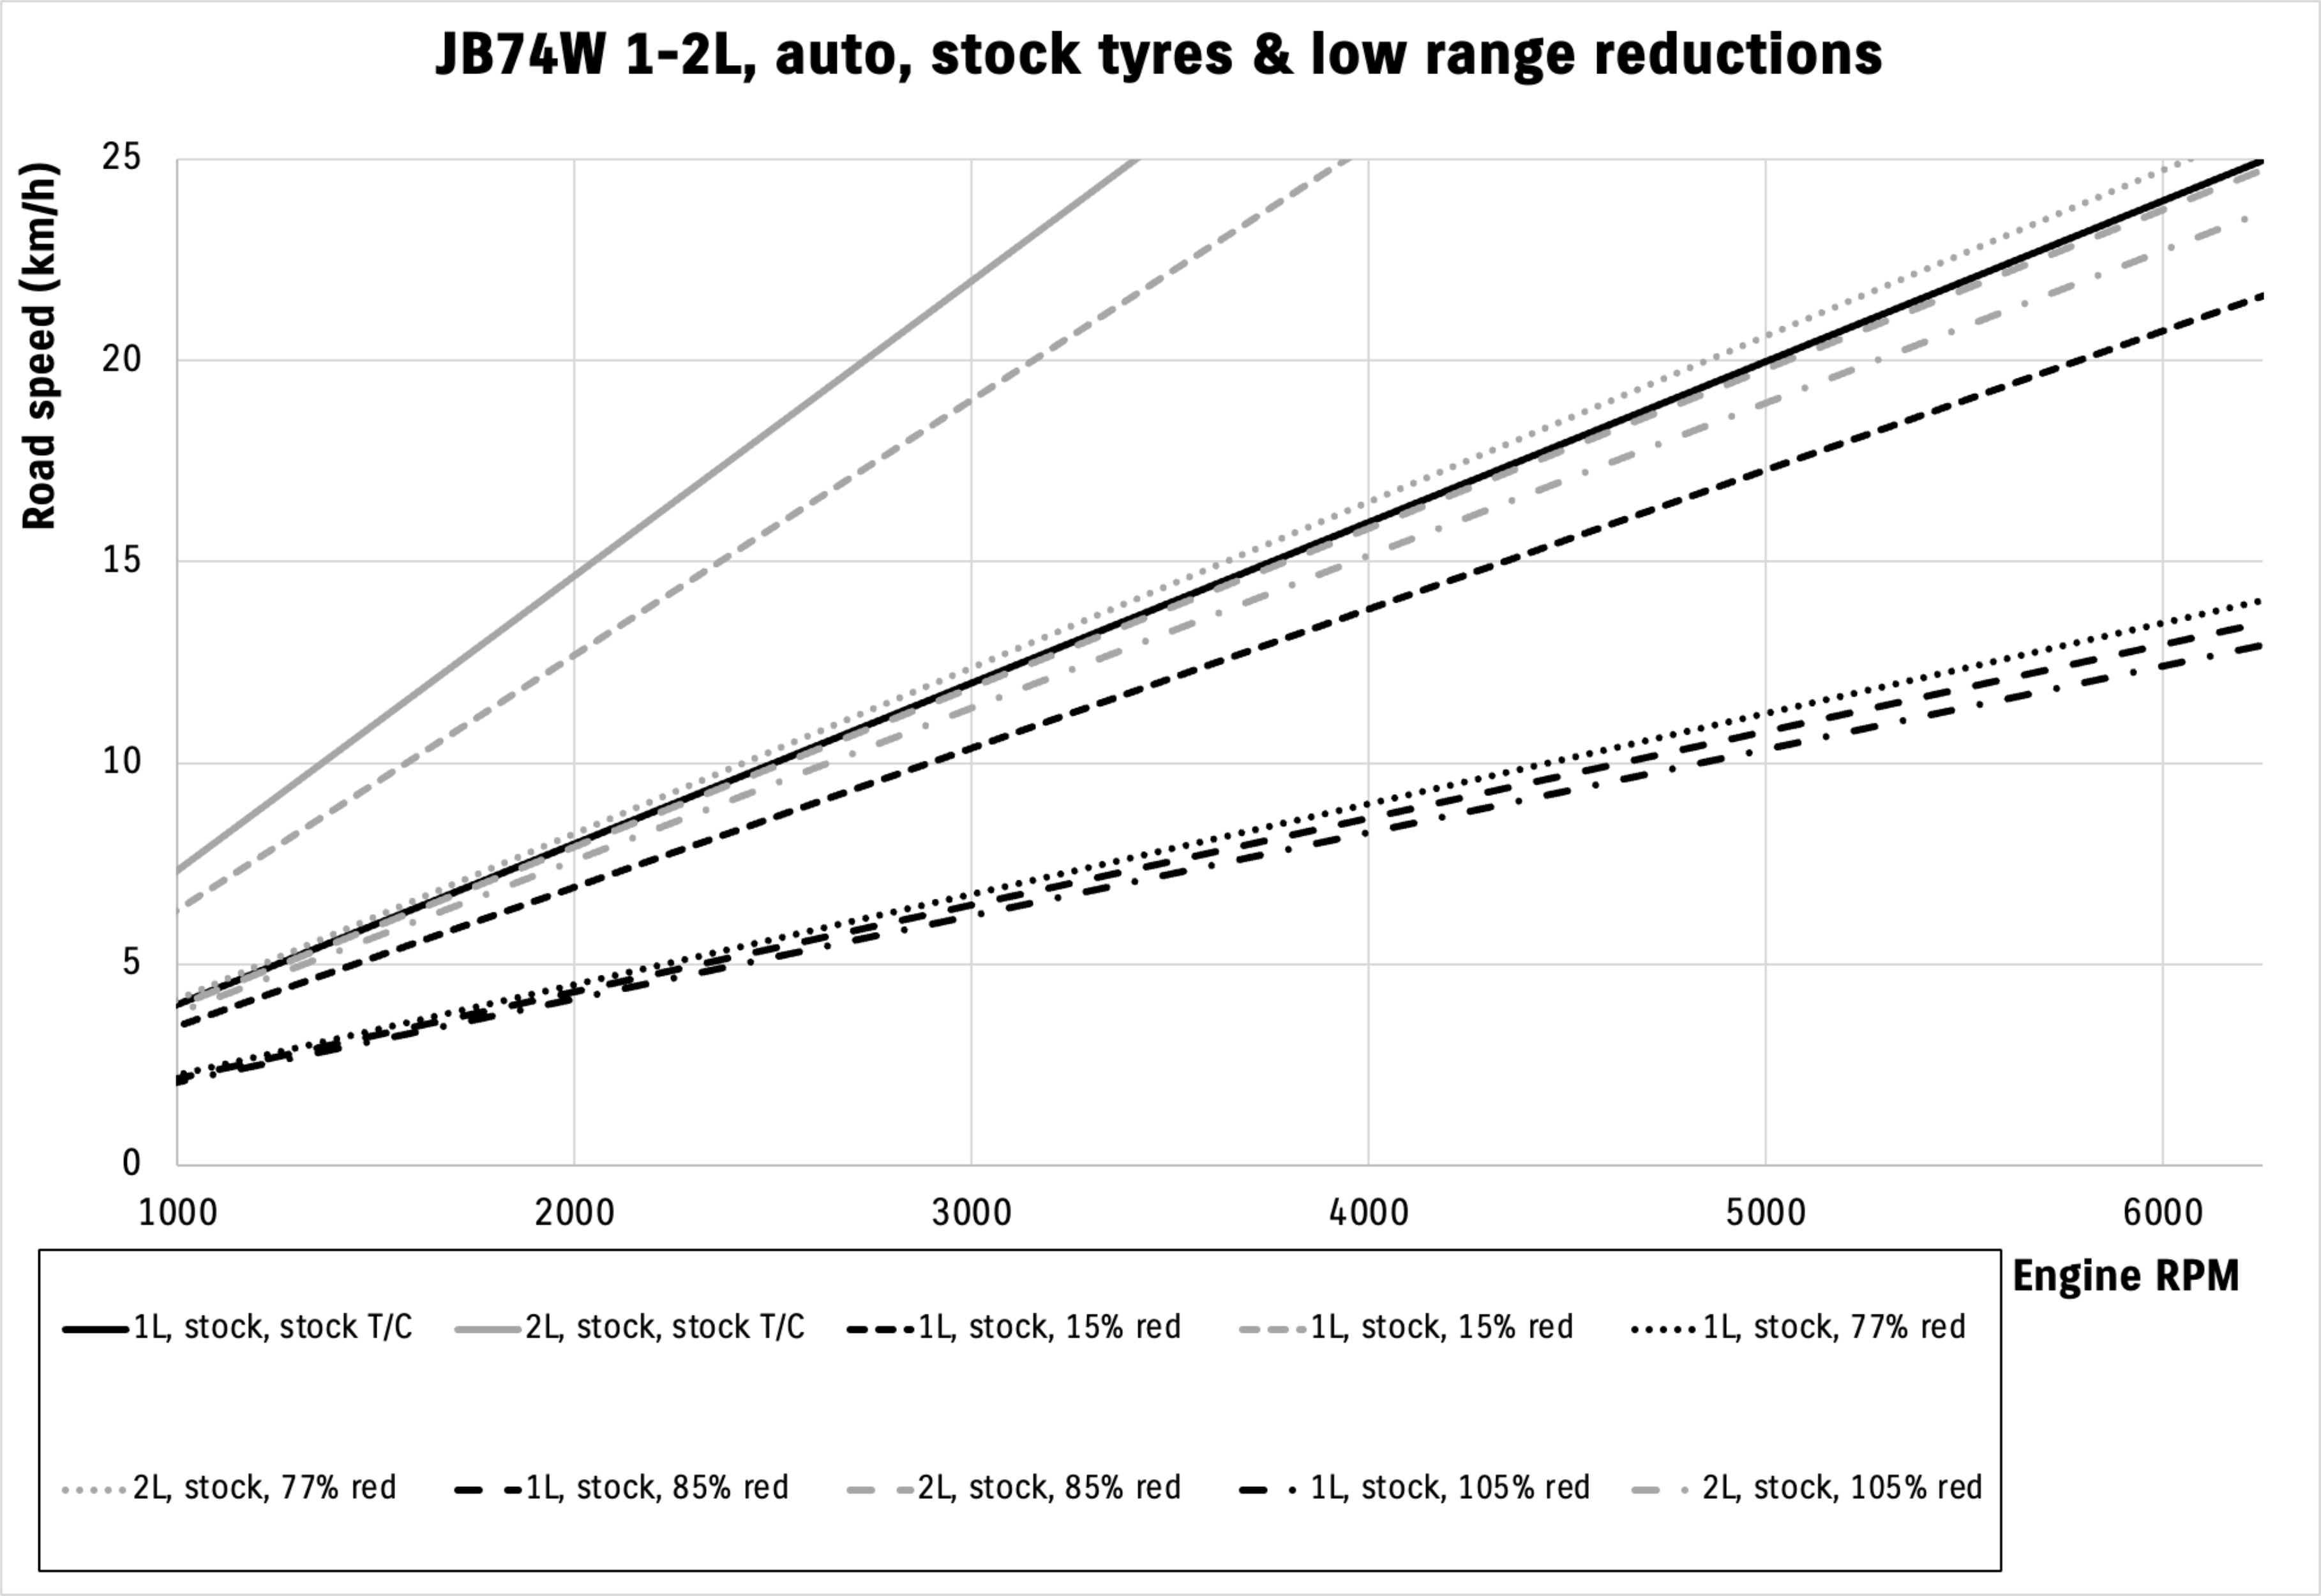
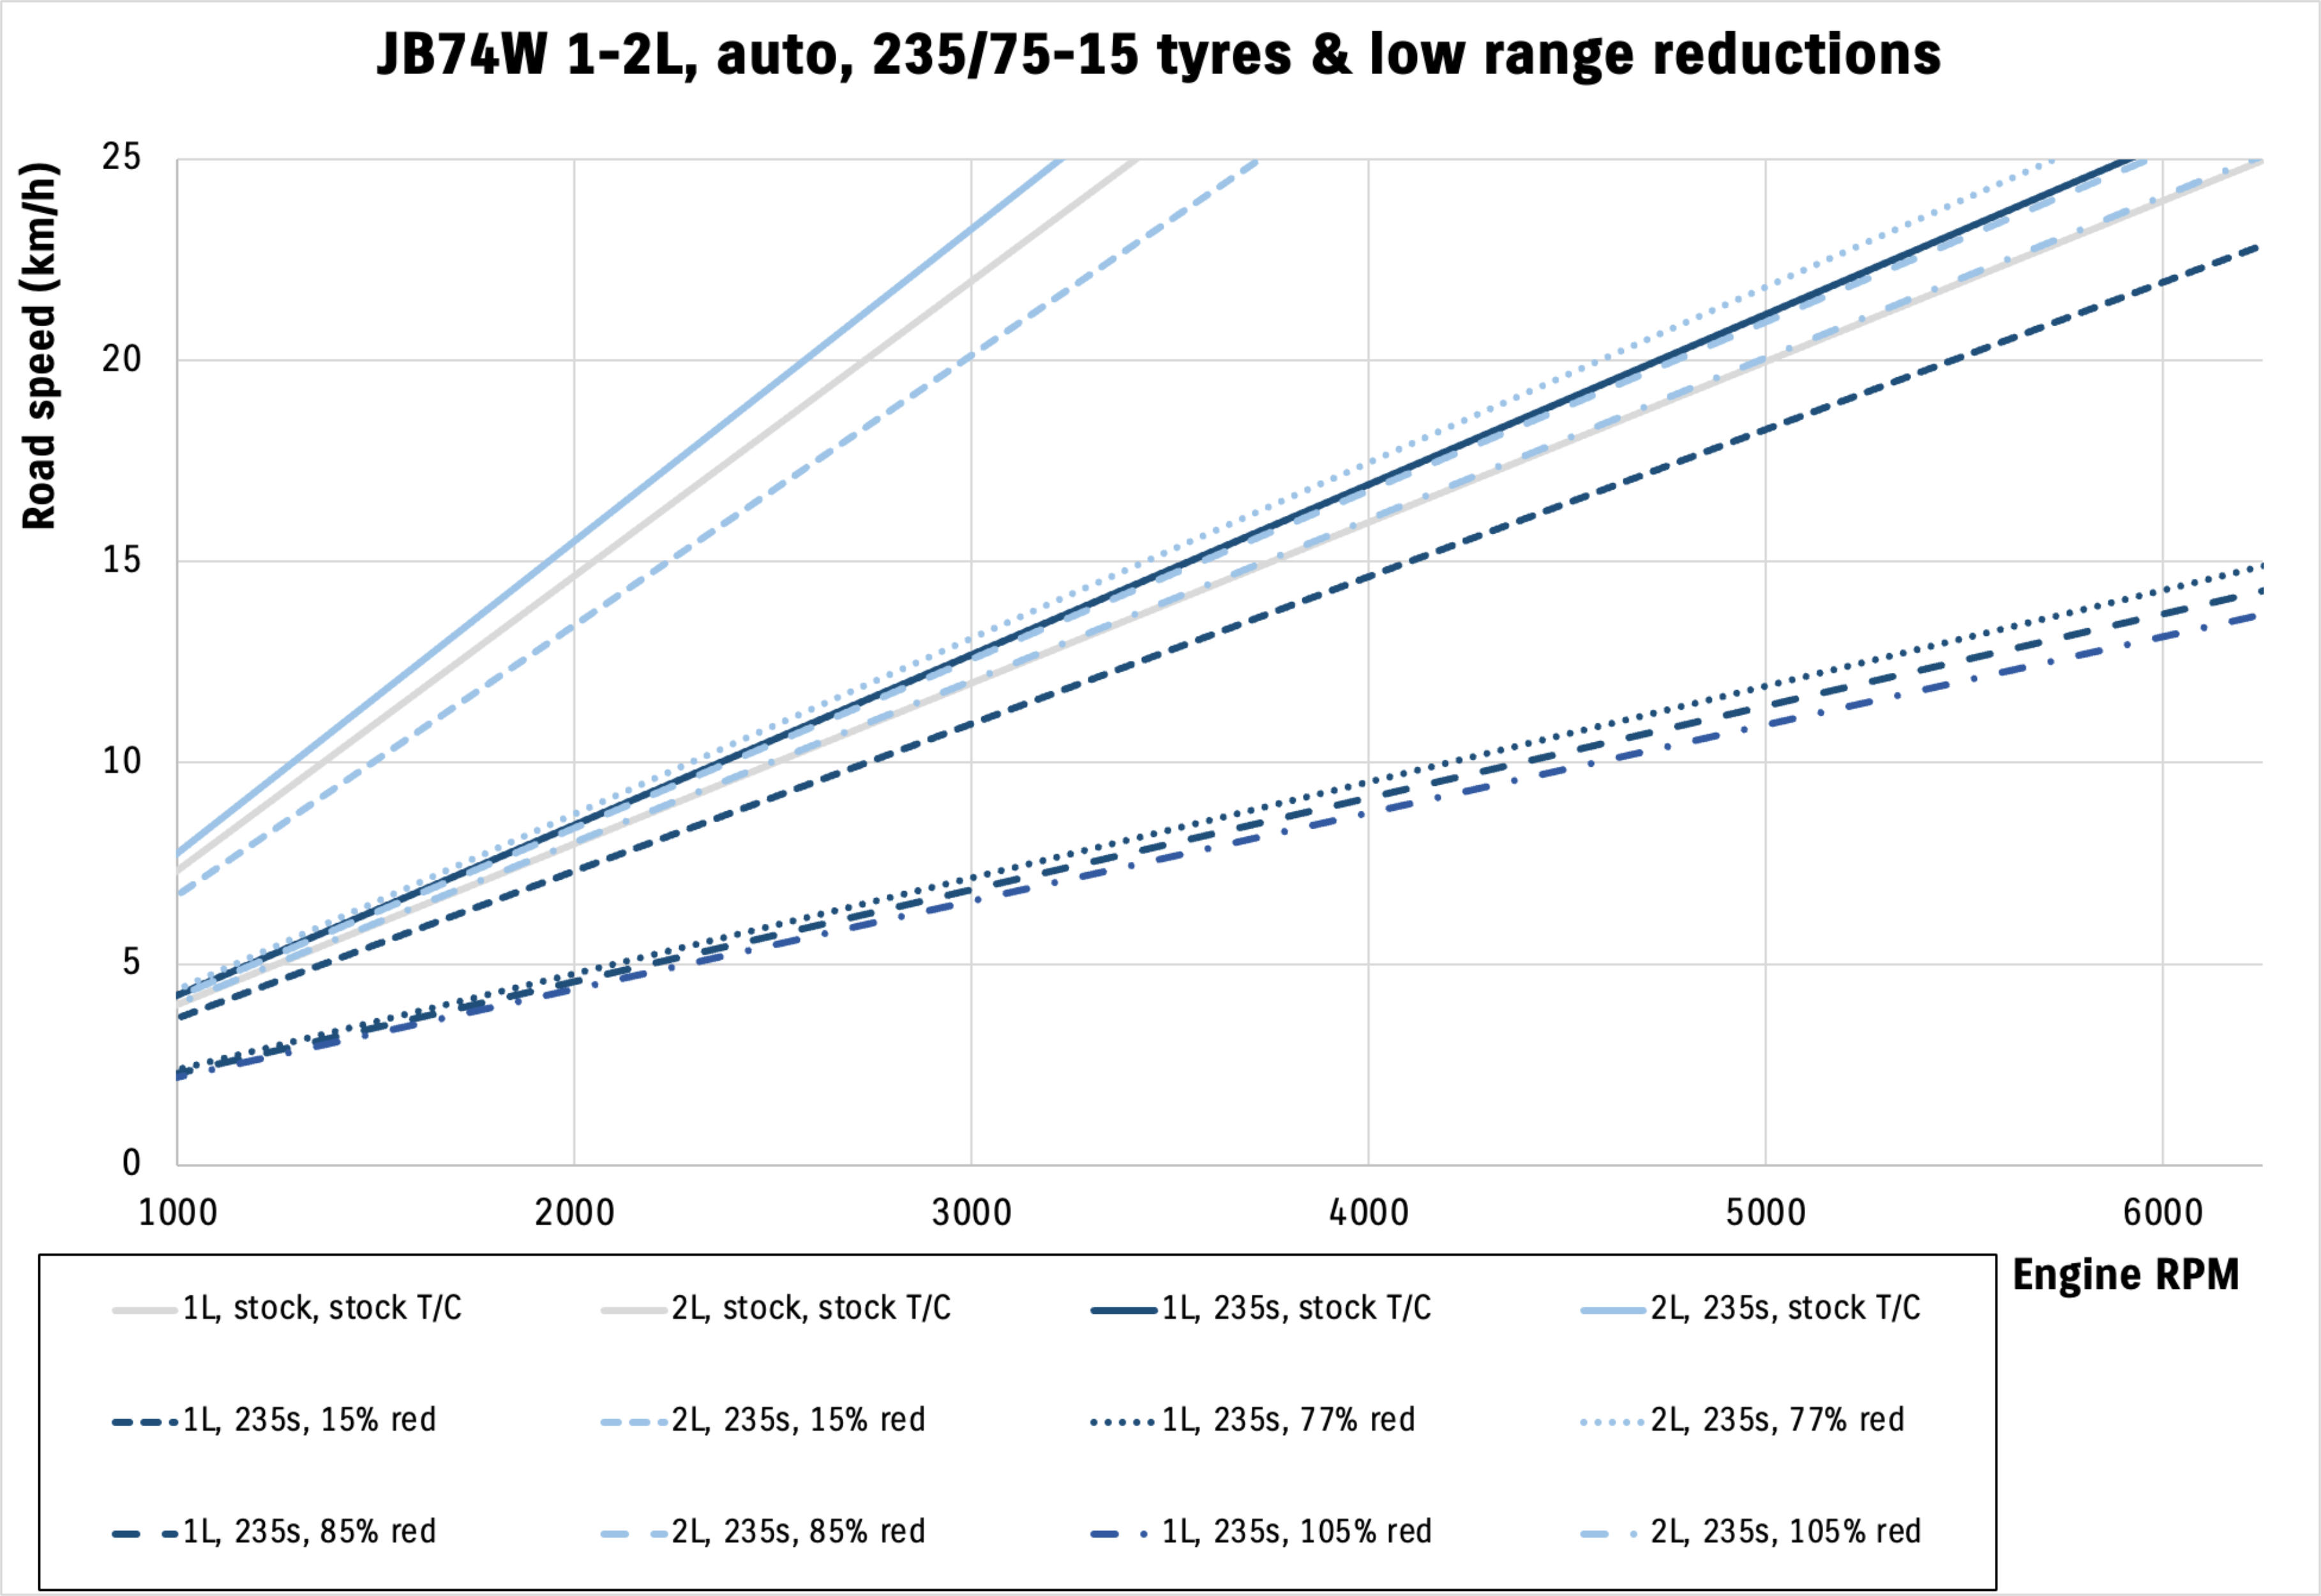
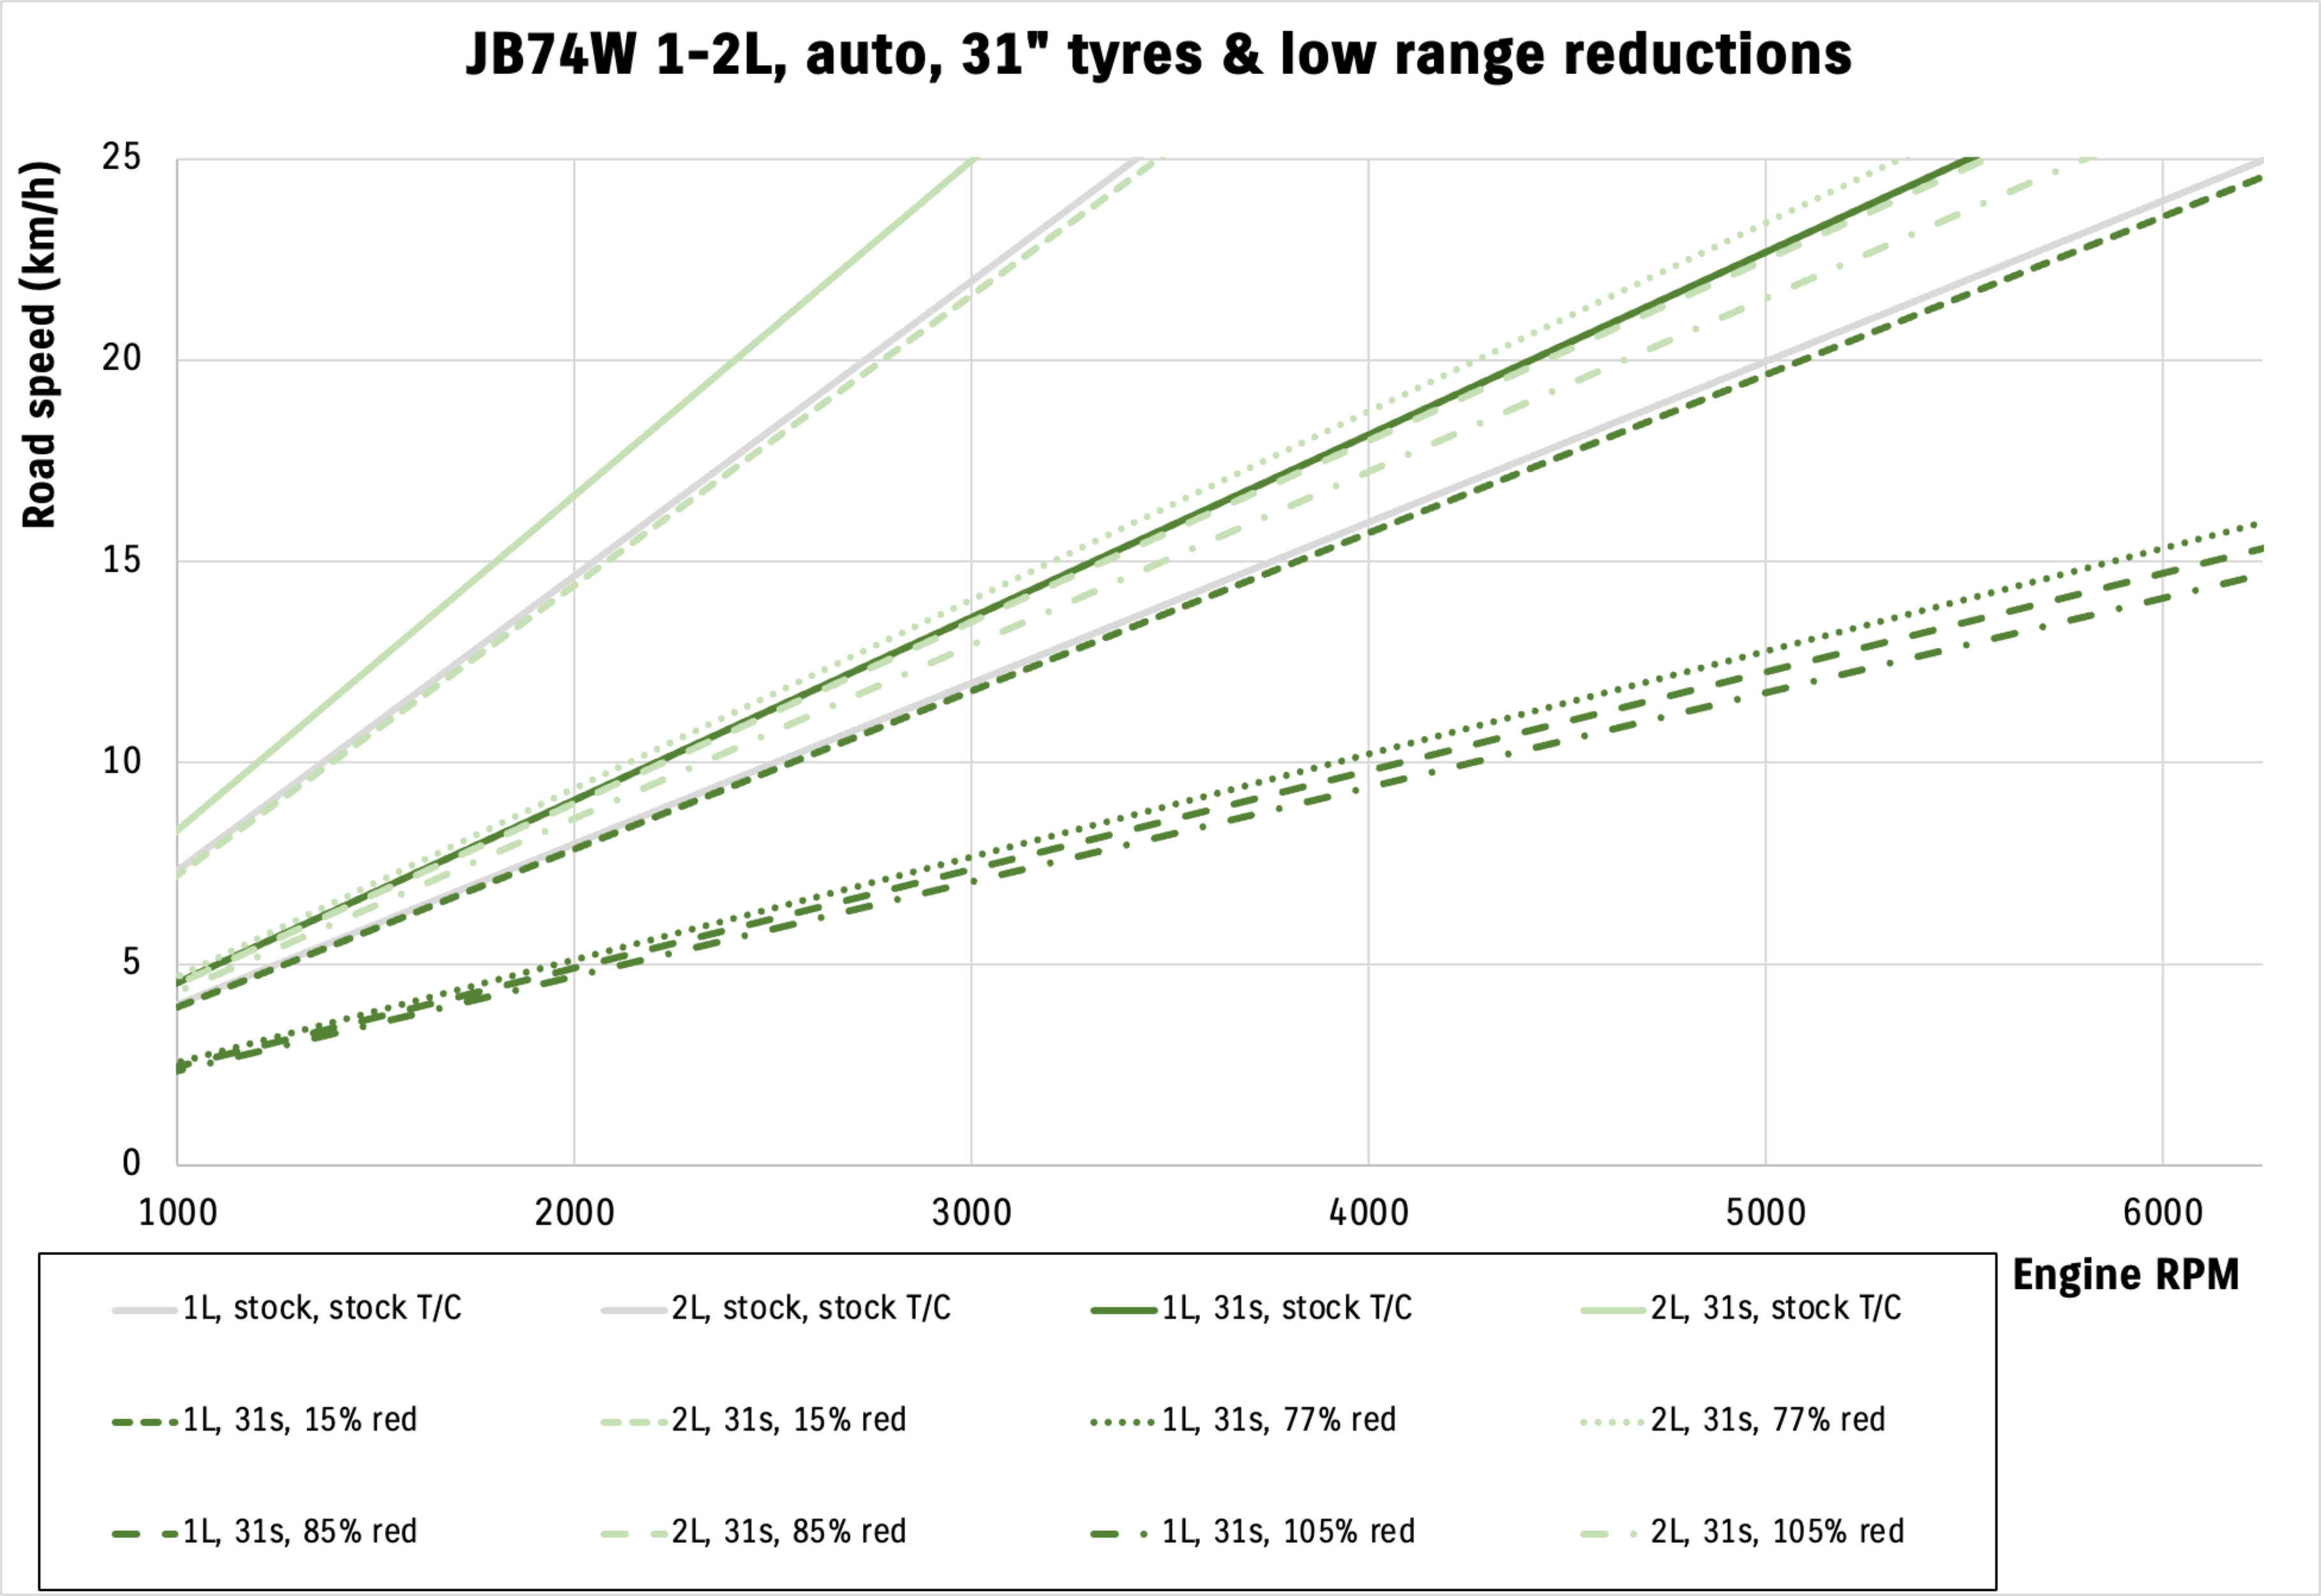
Beach cruising an auto with bigger tyres? 15% reduction gets you basically where stock is, which could be worthwhile. Otherwise similar to the manual, you basically are getting a low-low gear and 2nd gear low is where first gear low is standard, give or take a bit.
Deeper dive: apparent thrust
I introduced the concept of ‘apparent thrust’ pretty silently when discussing the effect of bigger tyres on your Jimny. Apparent thrust is just looking at how the torque from the engine multiplies through all of the relevant gear ratios, and then includes the leverage effect of the tyres. We start out with a dyno run of a stock Jimny; I’ve interpolated this and used the average of a couple of stock ones converted back to give roughly stock at the crank torque. (The weird, slightly blocky look is the result of graphing up the full interpolation function, which is discretised to only whole numbers).
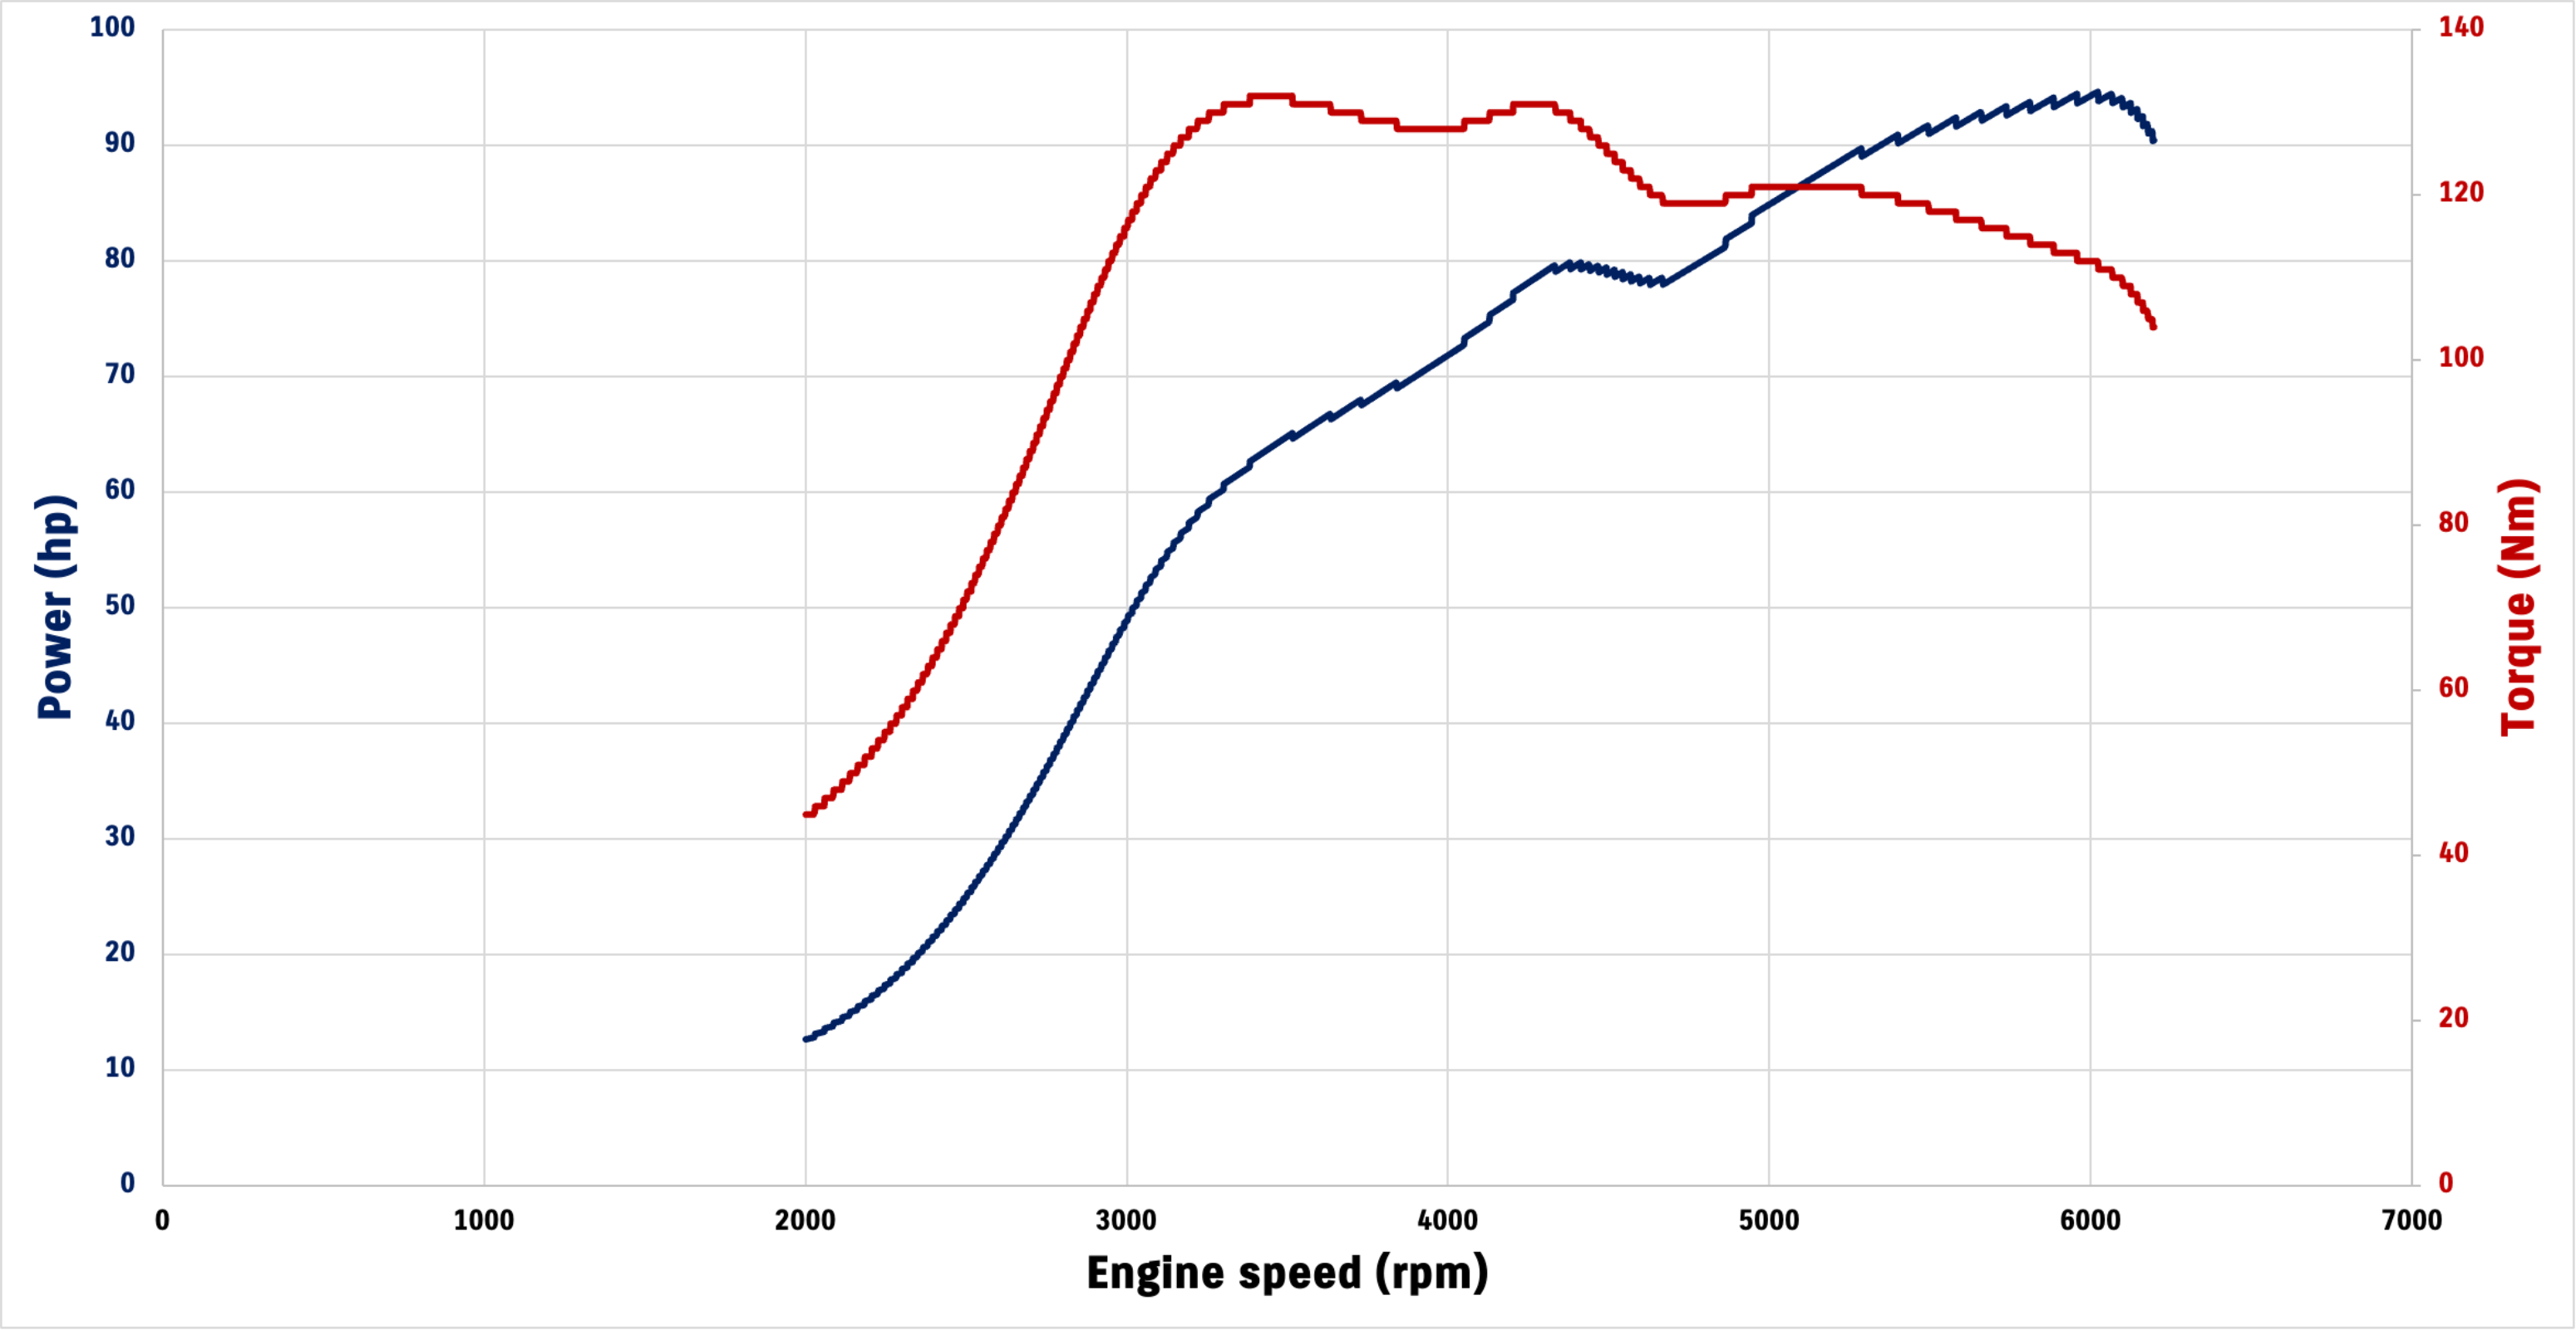
The amount of force the car can provide is the torque multiplied by the gearing. Gear ratios confuse people as they are the ratio of input to output speed. If you consider a Jimny’s manual first gear of 4.42:1, this means that it requires 4.42 rotations of the input for 1 output rotation. The flipside to that is you multiple the available torque by 4.42 times, as well. Let’s say we’re doing 4000 rpm in first gear: that 4000 rpm becomes 905 rpm (4000 / 4.42), but the 130 Nm available torque becomes 575 Nm (130 * 4.42).
Let’s say we’re in low range, which has a reduction of 2:1. Now our 4000 rpm at the engine has become 905 rpm input to the transfer case, and the output of the transfer case is 453 rpm. Our 130 Nm at the engine, however, is now 1150 Nm at the output of the transfer case. Then we can consider the differential ratio of 4.09:1. Our propshaft is spinning at the speed of the output of the transfer case (453 rpm), but that translates to 110.8 rpm at the axles. The axles, however, are now getting 4704 Nm of torque thanks to gearing multiplication.
To work out what force (which is what provides acceleration) that 4704 Nm works out to be, we need to divide by the lever that it is acting over: this is the overall tyre radius. A 195/80-15 tyre works out to have a total radius of half of the wheel diameter (so 7.5″ or 190.5 mm) plus the sidewall height (190 * 0.8 = 152 mm), or, a total radius of 343 mm. We need this in metres, so 0.343 m.
Divide through our torque at the axle (4704 Nm) with the wheel radius (0.343 m) and we get a grand total of 13,714 N of force to accelerate our car in first gear, low range, at 4000 rpm. Another way to look at this is it is 1399 kg of ‘force’ when people talk about force in terms of weight (which annoys me). A more common expression might be the ‘lb’ rating of a winch: a manual Jimny in low range at 4000 rpm is a 3077 lb winch.
We digress. We also need to look at the road speed for that given 110.8 rpm at the axle (4000 rpm at the engine). Every rotation of a 195/80-15 tyre is pi times the overall diameter of the tyre: 2.177 m. This means every minute our car is travelling 110.8 rpm * 2.177 m = 241 m. If you multiply this by 60 to find out how far it goes in an hour, then you get 14460 m, or 14.46 km. Thus, at 4000 rpm in first gear low range in a manual Jimny, you are doing 14.46 km/h with an available apparent thrust of 13,714 N.
If you do all of the above together for every gear ratio possible, and you also do it for an automatic transmission, you get the following chart. This is also interpolating back to 0 rpm purely to make my life a bit easier but ignore the initial parts of the thrust curves as they’re a bit arbitrary.
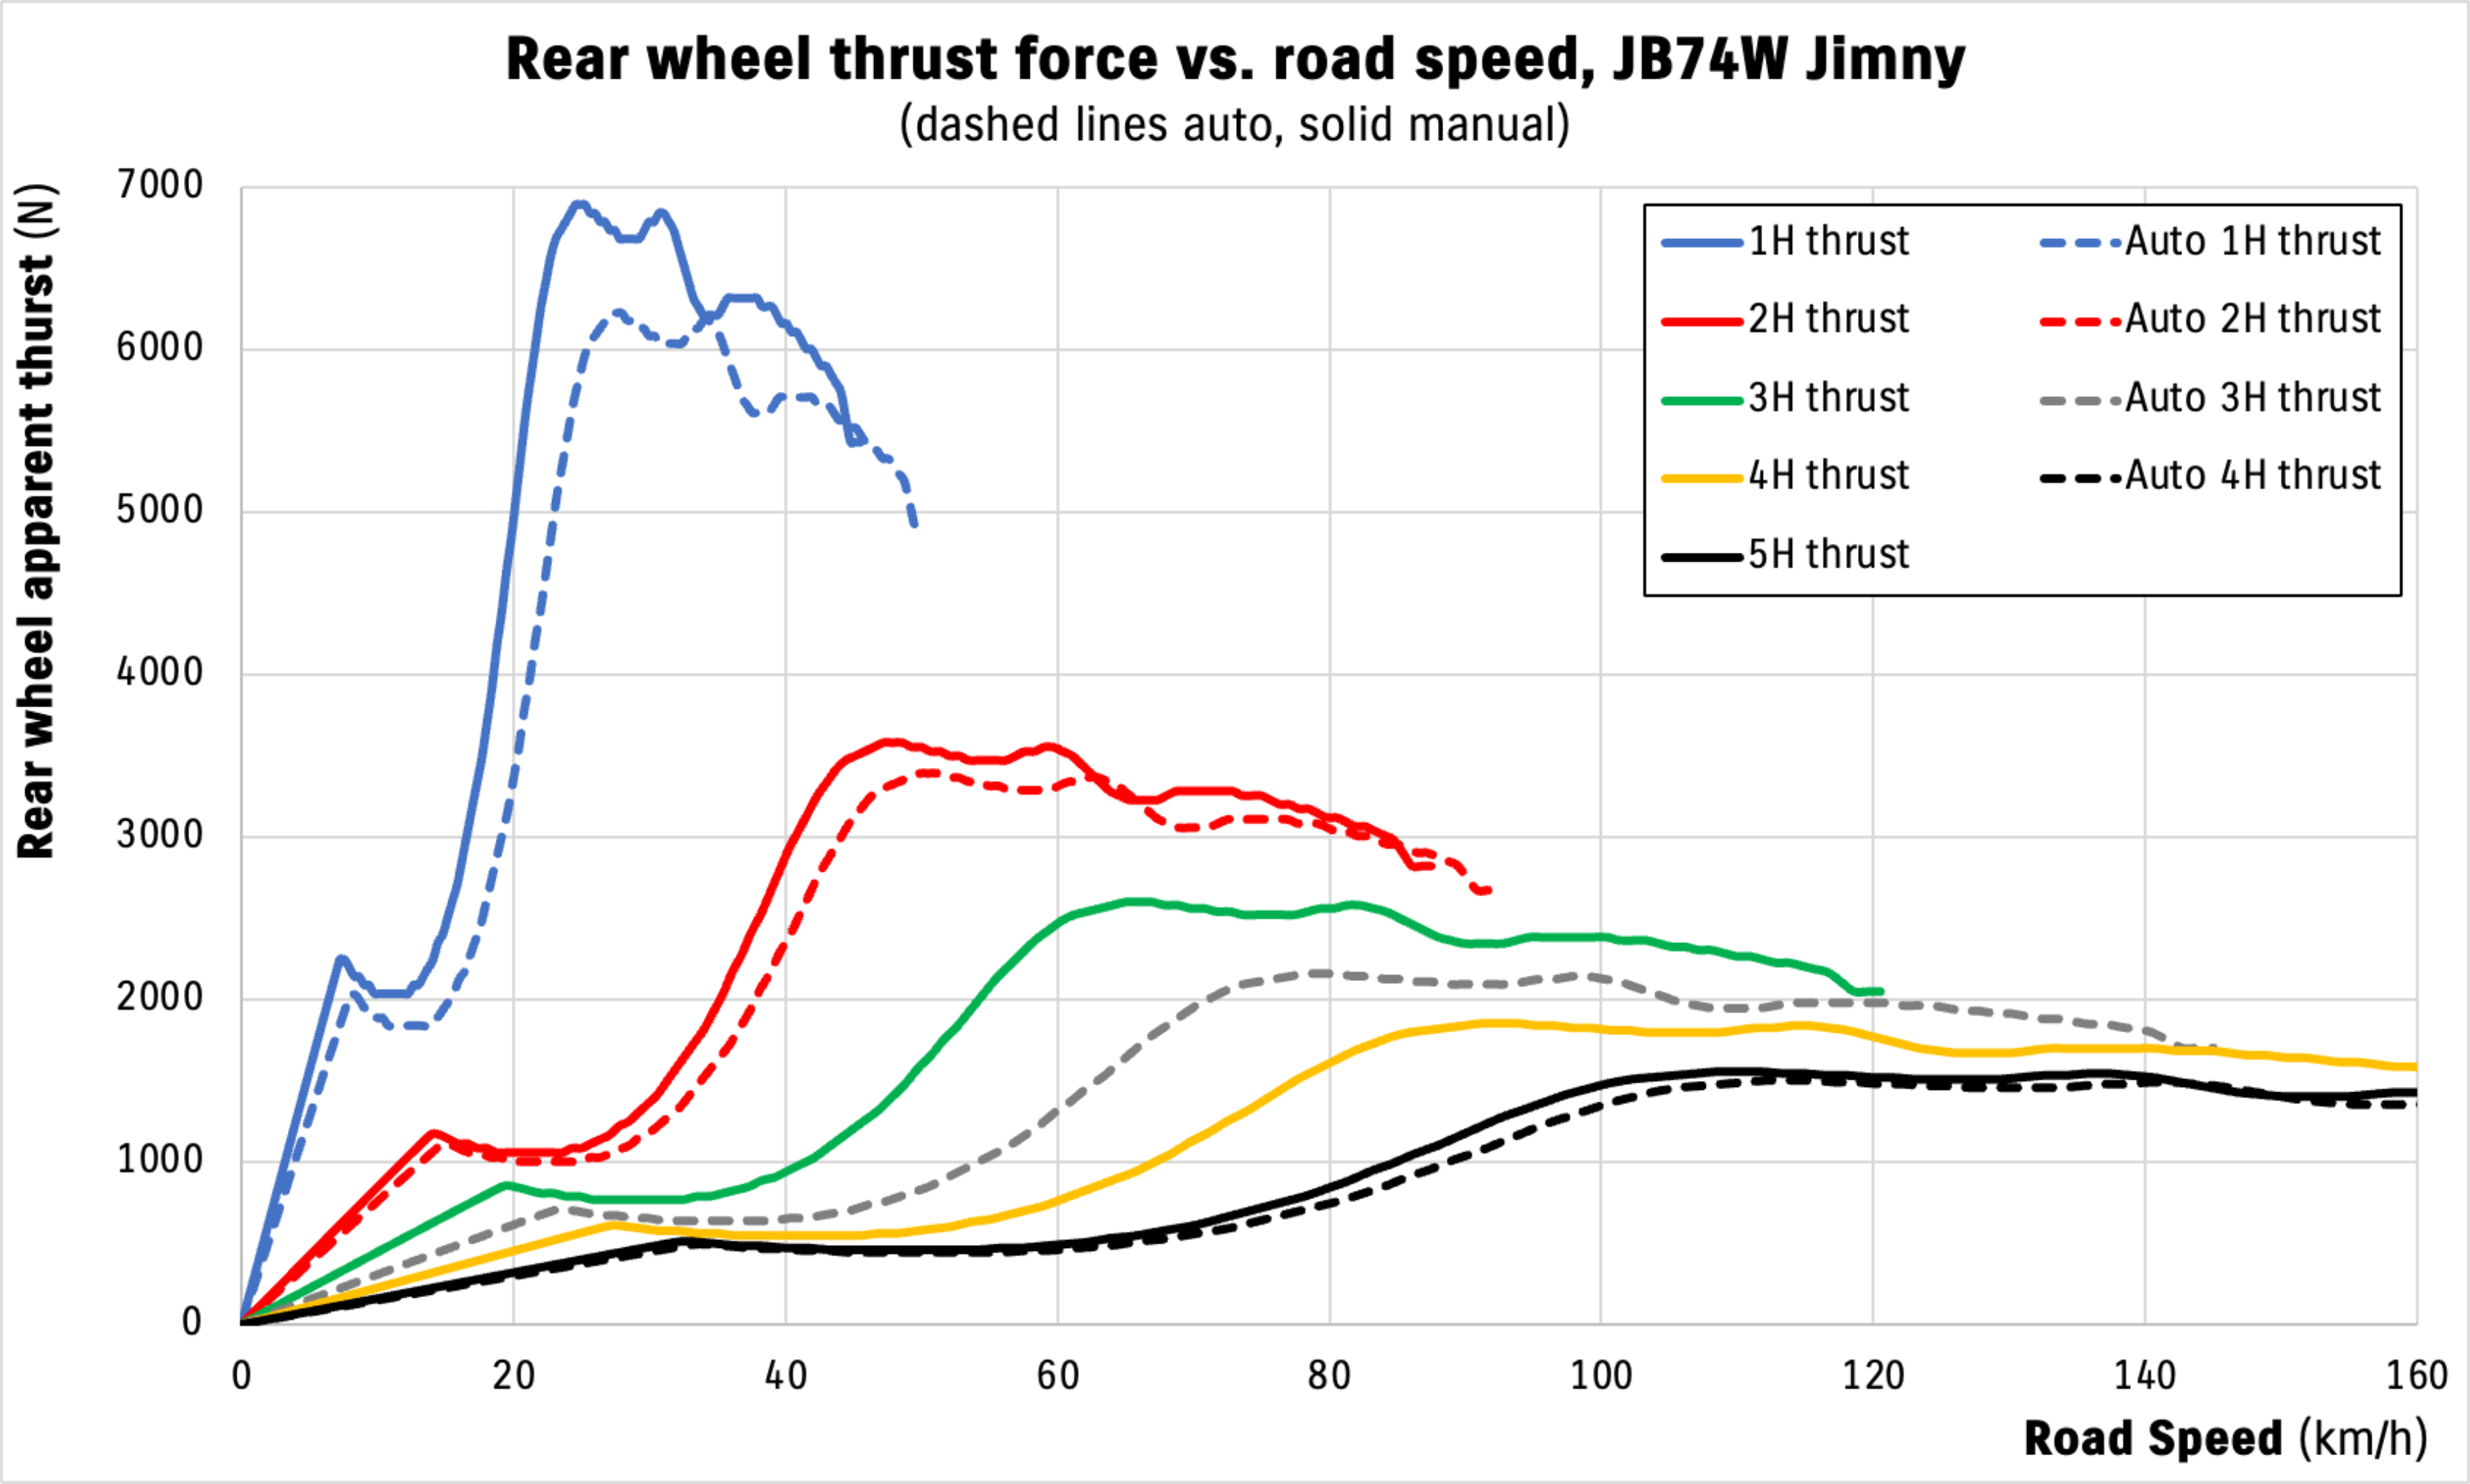
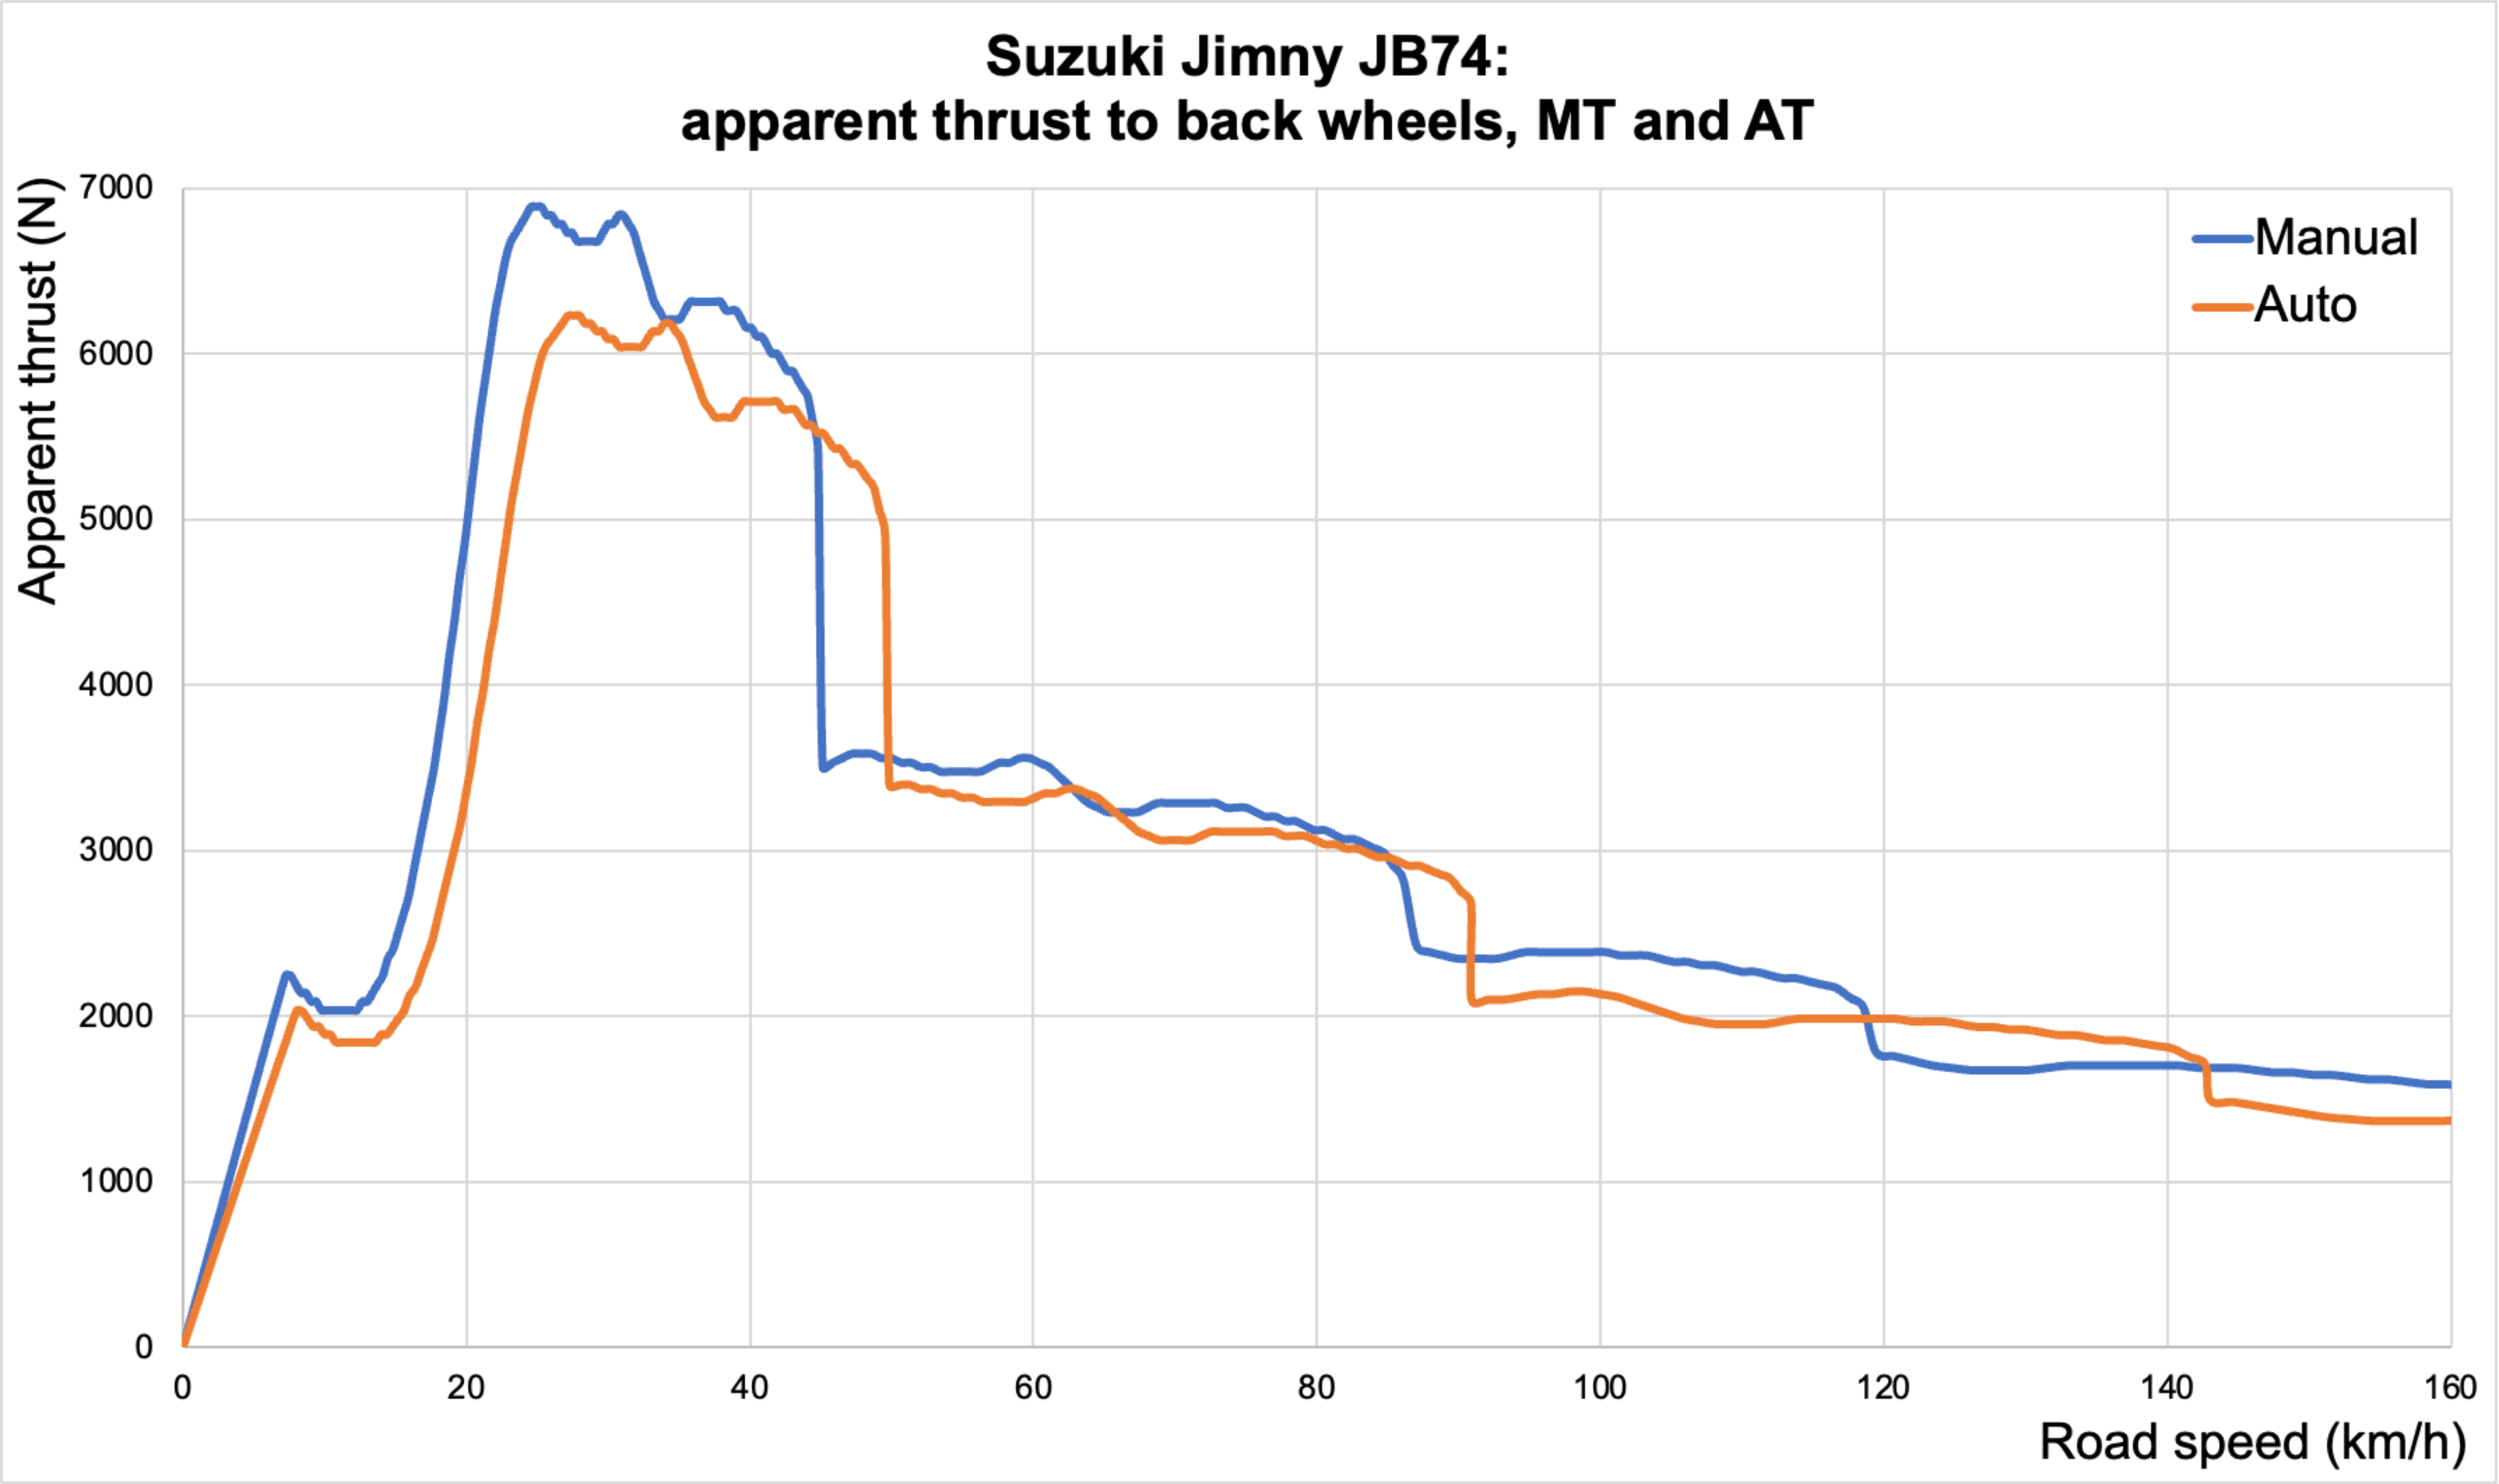
This is fundamentally why a manual Jimny accelerates faster than an automatic Jimny. For any given road speed other than a couple of rare exceptions, the manual Jimny always has more thrust available to its back wheels thanks to gearing multiplication helping out. You’ll see it’s close on the highway in top gear, but everywhere else the Jimny has more thrust available with a manual transmission than with an automatic transmission. Since acceleration = force divided by mass (yay Newton’s 2nd law), the greater force means a greater acceleration.
It’s hard to visualise with all the gears plotted together; you can build up a composite thrust curve for each transmission to get a bit of a better idea about how acceleration varies with road speed.
Effect of converter ratio on available thrust/torque
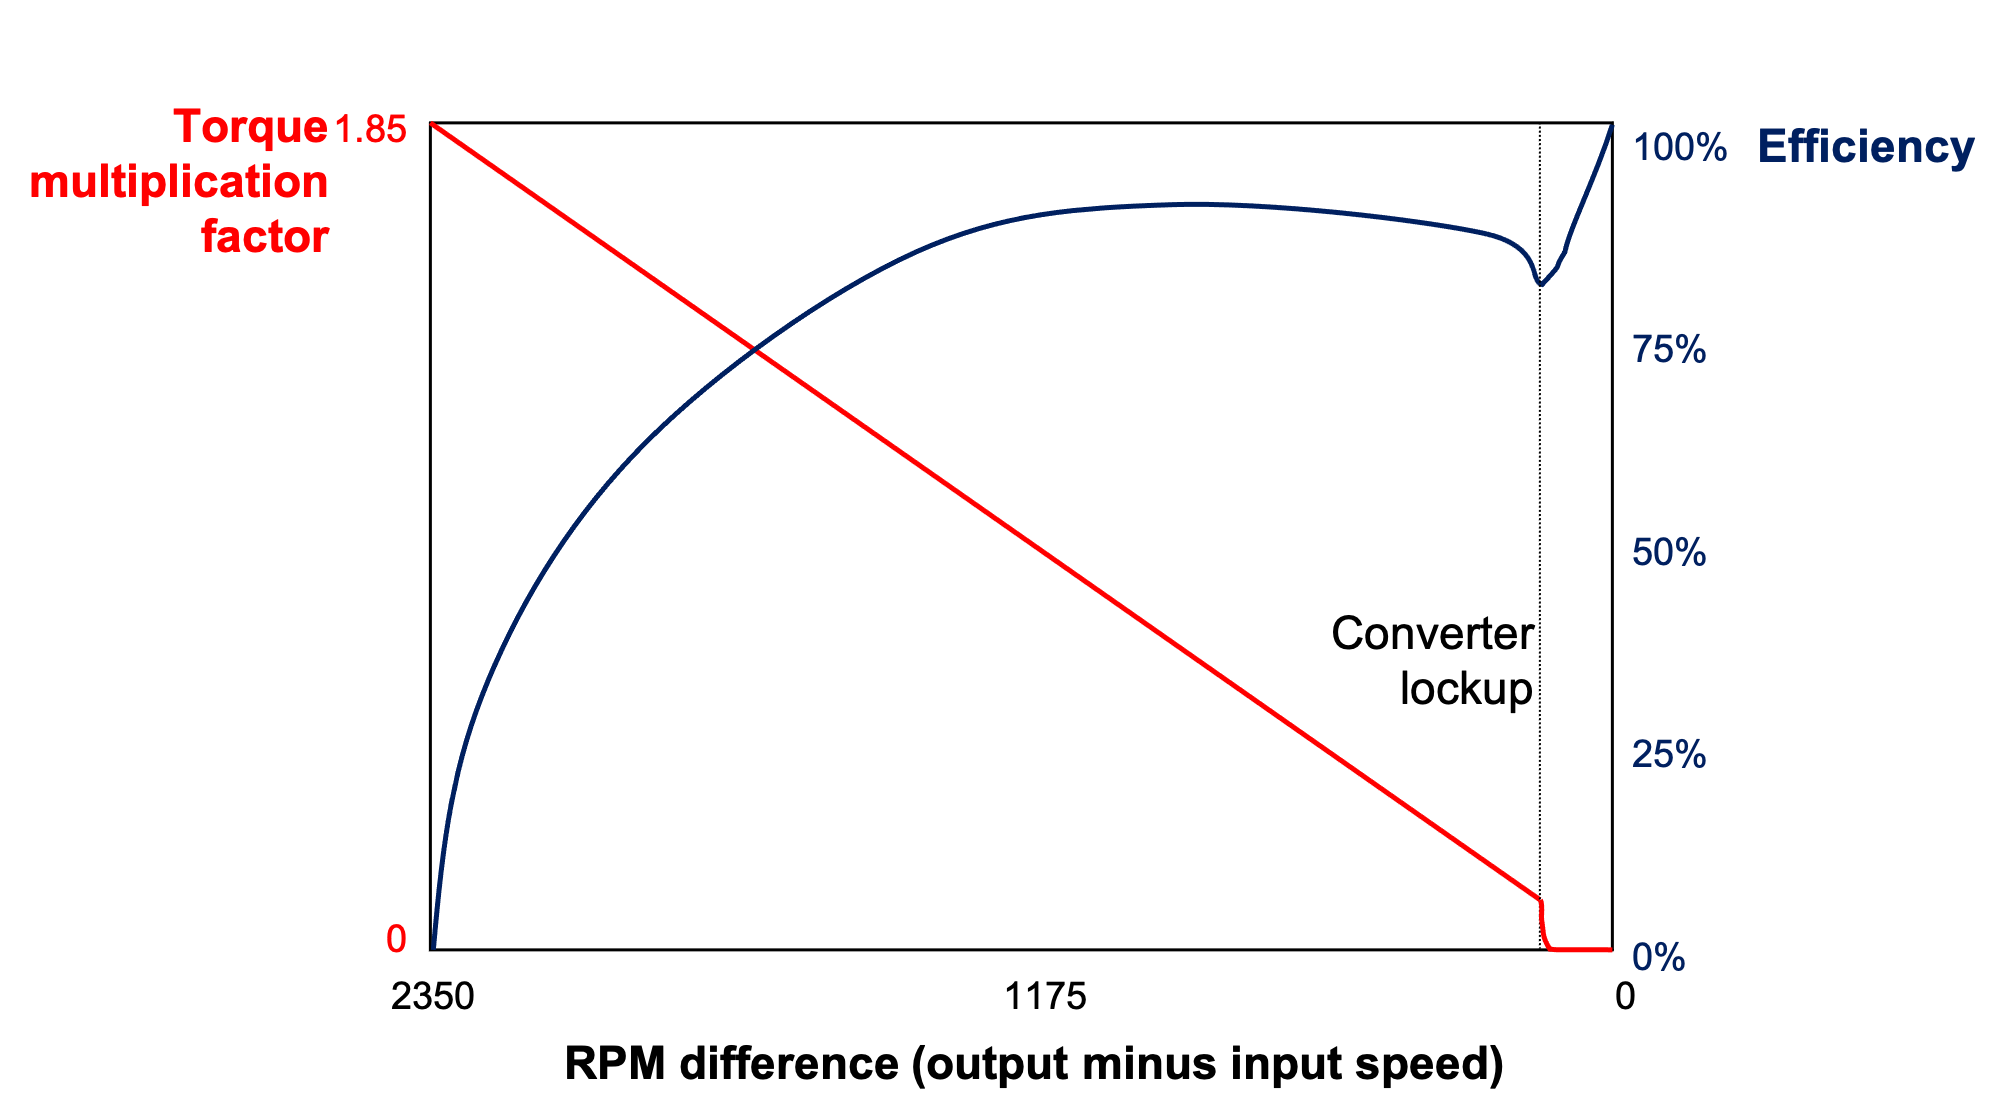
There is an additional twist with an automatic transmission car: they have a torque converter, and a torque converter changes the relationship between input speed and torque and output speed and torque. They do this by being a fluid-based coupling where input and output are only connected via a fluid. As the input accelerates, there is a lag between acceleration of the output, which increases the force applied while there’s a big speed difference between output and input speed. This is the torque multiplication and is why they are called a torque converter. The amount of torque increase is the ‘converter ratio’, and there is a maximum speed difference between input and output speed, termed the ‘stall speed’.
At some point, as the fluid has caught up in speed between input and output speed, there is only a tiny bit of slip caused by the viscosity of the fluid and there’s minimal to no torque multiplication any more. If you depict this as a graph, you get a converter response graph a bit like the following. I’ll go into converter lockup shortly, but the key element is that the torque multiplication of a converter is not constant and it is proportional to the speed difference between input and output. Also, you don’t get something for nothing: the more slip, the less efficient the converter is and that energy goes into the fluid, heating it up. For this graph I have used the official converter ratio (1.85:1) and maximum stall speed for the JB74 torque converter.
To look at a practical example of the slip in a torque converter, I looked at an acceleration video off youtube for an automatic JB74. By grabbing the speed and rpm out of the video, and plotting these against time, you can see the moments where the converter is slipping more. Essentially when you have more rpm than you would expect for a given speed you are slipping more, and then when everything’s mostly caught up and everything’s equally accelerating you have less converter slip. Note there is more slip when there is more load in a higher gear (especially with the shift into 4th).
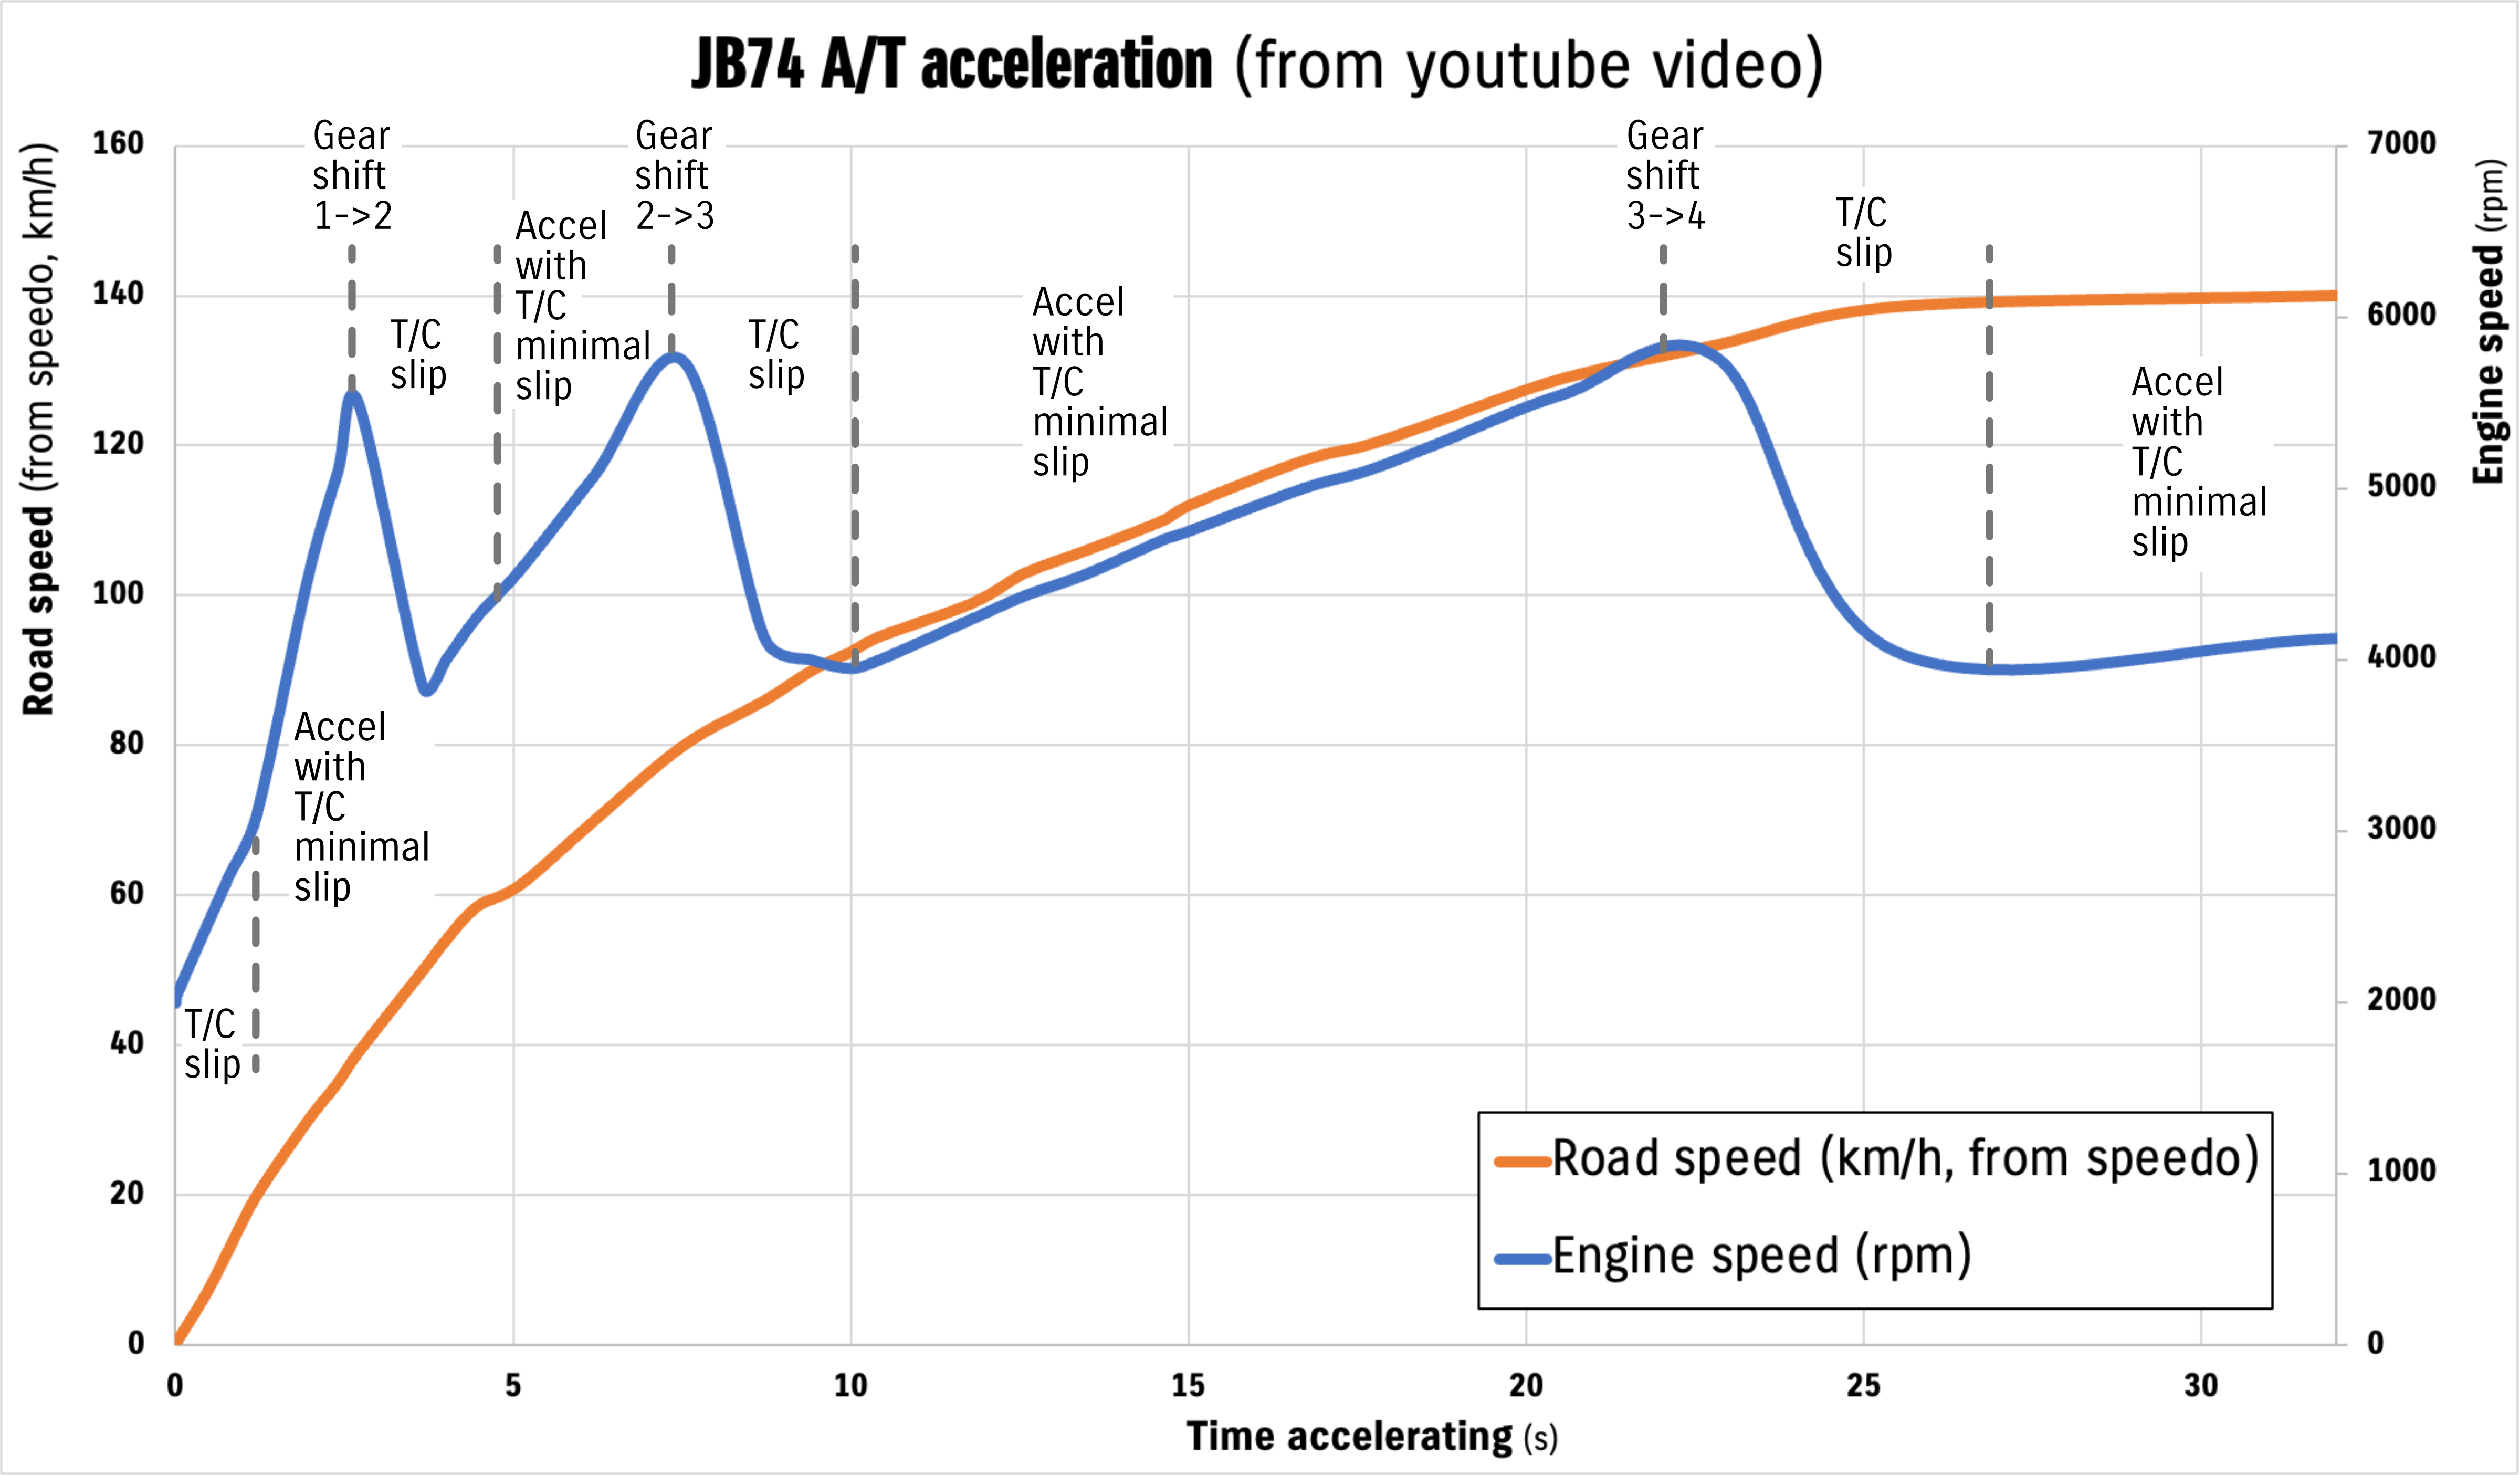
In terms of total torque multiplication available, you need to look at the stall speed of the torque converter and the converter ratio. The stall speed is given by the maximum engine RPM that can be achieved loading up the engine against the brake. The specification for a JB74 stall speed is you will get to a maximum RPM of between 2000 and 2650 rpm stalling the converter out. To be conservative I’ve called this 2350 rpm in the earlier graph. For this speed difference you get a maximum of 1.85x torque increase from the converter ratio. Given the engine makes a maximum of 130 Nm at 4000 rpm, this means your absolute best case for converter multiplication would be going along at an output speed for the converter that equates to 1650 rpm, and if you could fully stall it out at that road speed you’d get 240.5 Nm temporarily through the converter. This is not so likely, much more likely would be doing ~2350 rpm stalled up against a rock as you’re trying to crawl up it; for this situation the engine is only making about 60 Nm i.e. 111 Nm after the torque converter has done its thing.
That’s why automatics are easier to rock crawl, and a bit more resistant to worry about gear ratios for crawling up obstacles with bigger tyres. You basically use the converter slip to make up for the gearing loss with the bigger tyres, at the expense of a bit more fluid heating of the transmission fluid. In a manual to get more torque you’d be revving the car more and dumping the clutch, which is not kind on the driveline or the clutch.
In addition to the torque converter’s ability to multiple torque, the Jimny’s converter is also capable of lockup i.e. completely locking out the slip. This is engaged only in 3rd and 4th gears and only under sufficiently low load on the highway. This feels a bit like a gear shift when it locks or unlocks and either drops or gains RPM at a given speed, but it is just stopping or allowing the converter to slip again. While there are no published load amounts where it is unlocked, this is one of the causes for worse fuel economy fitting bigger tyres: the extra load on the engine on the highway means the converter spends less time locked up, and therefore you have more energy going into converter slip and heating up the transmission fluid.
Estimating aerodynamic drag using apparent thrust and top speed
This one is a little tricky but it’s worth stepping through and it sets up the final topic about the Jimny I want to discuss, too. We want to look at the drag of the Jimny.
Top speed for cars is usually aerodynamically limited. At the top speed on a flat road with no wind, the top speed is reached where the thrust in top gear provided by the engine balances the aerodynamic forces. (At high speed, aerodynamics massively outweighs rolling resistance, so it slightly overestimates aerodynamic drag).
We can get an idea on the top speed using this following video.
Ultimately the car hits about 165 km/h on the speedometer; accounting for the Jimny’s typical 5% speedometer error that’s somewhere around 157-158 km/h. We can go back to our chart of thrust versus road speed and see that for 5th gear we hit this speed at ~4915 rpm and we have a little local peak of thrust of ~1428 N at the back wheels for a stock manual setup.
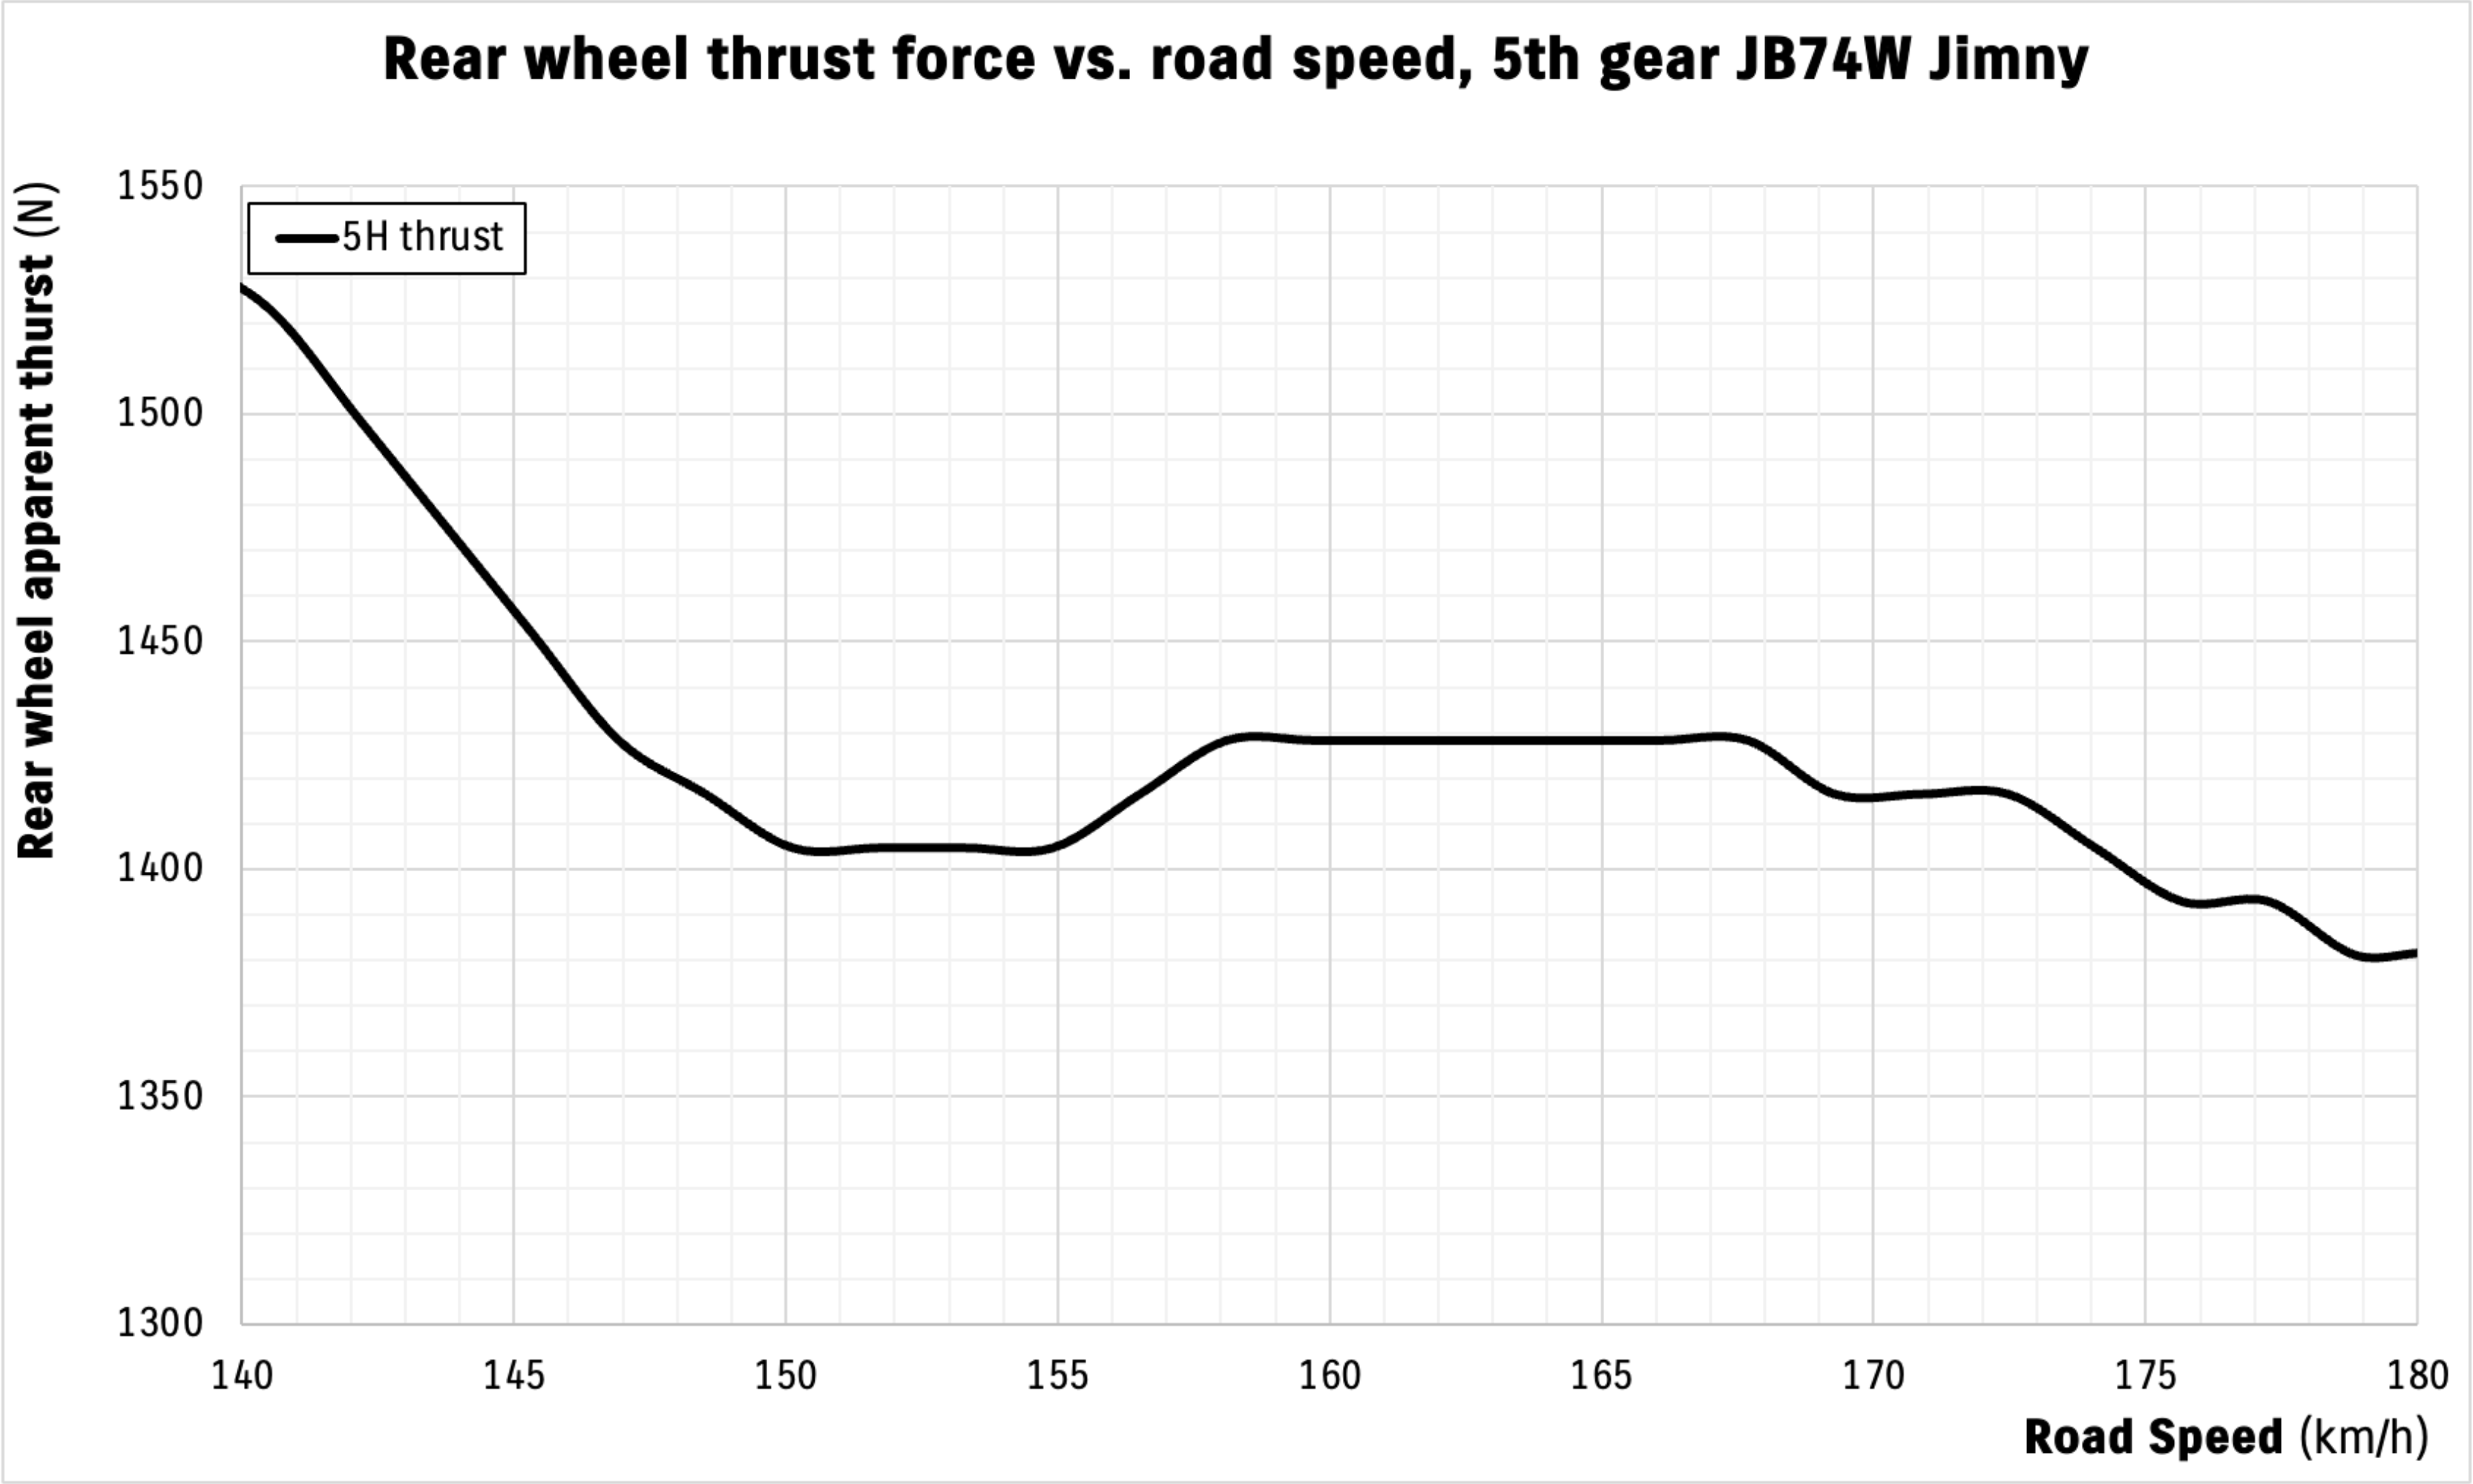
So we can conclude that the aerodynamic drag force at ~158 km/h road speed is around 1428 N.
Aerodynamic drag increases with the square of speed, and is obviously 0 at 0 km/h. We can use this to estimate the drag at every potential speed.
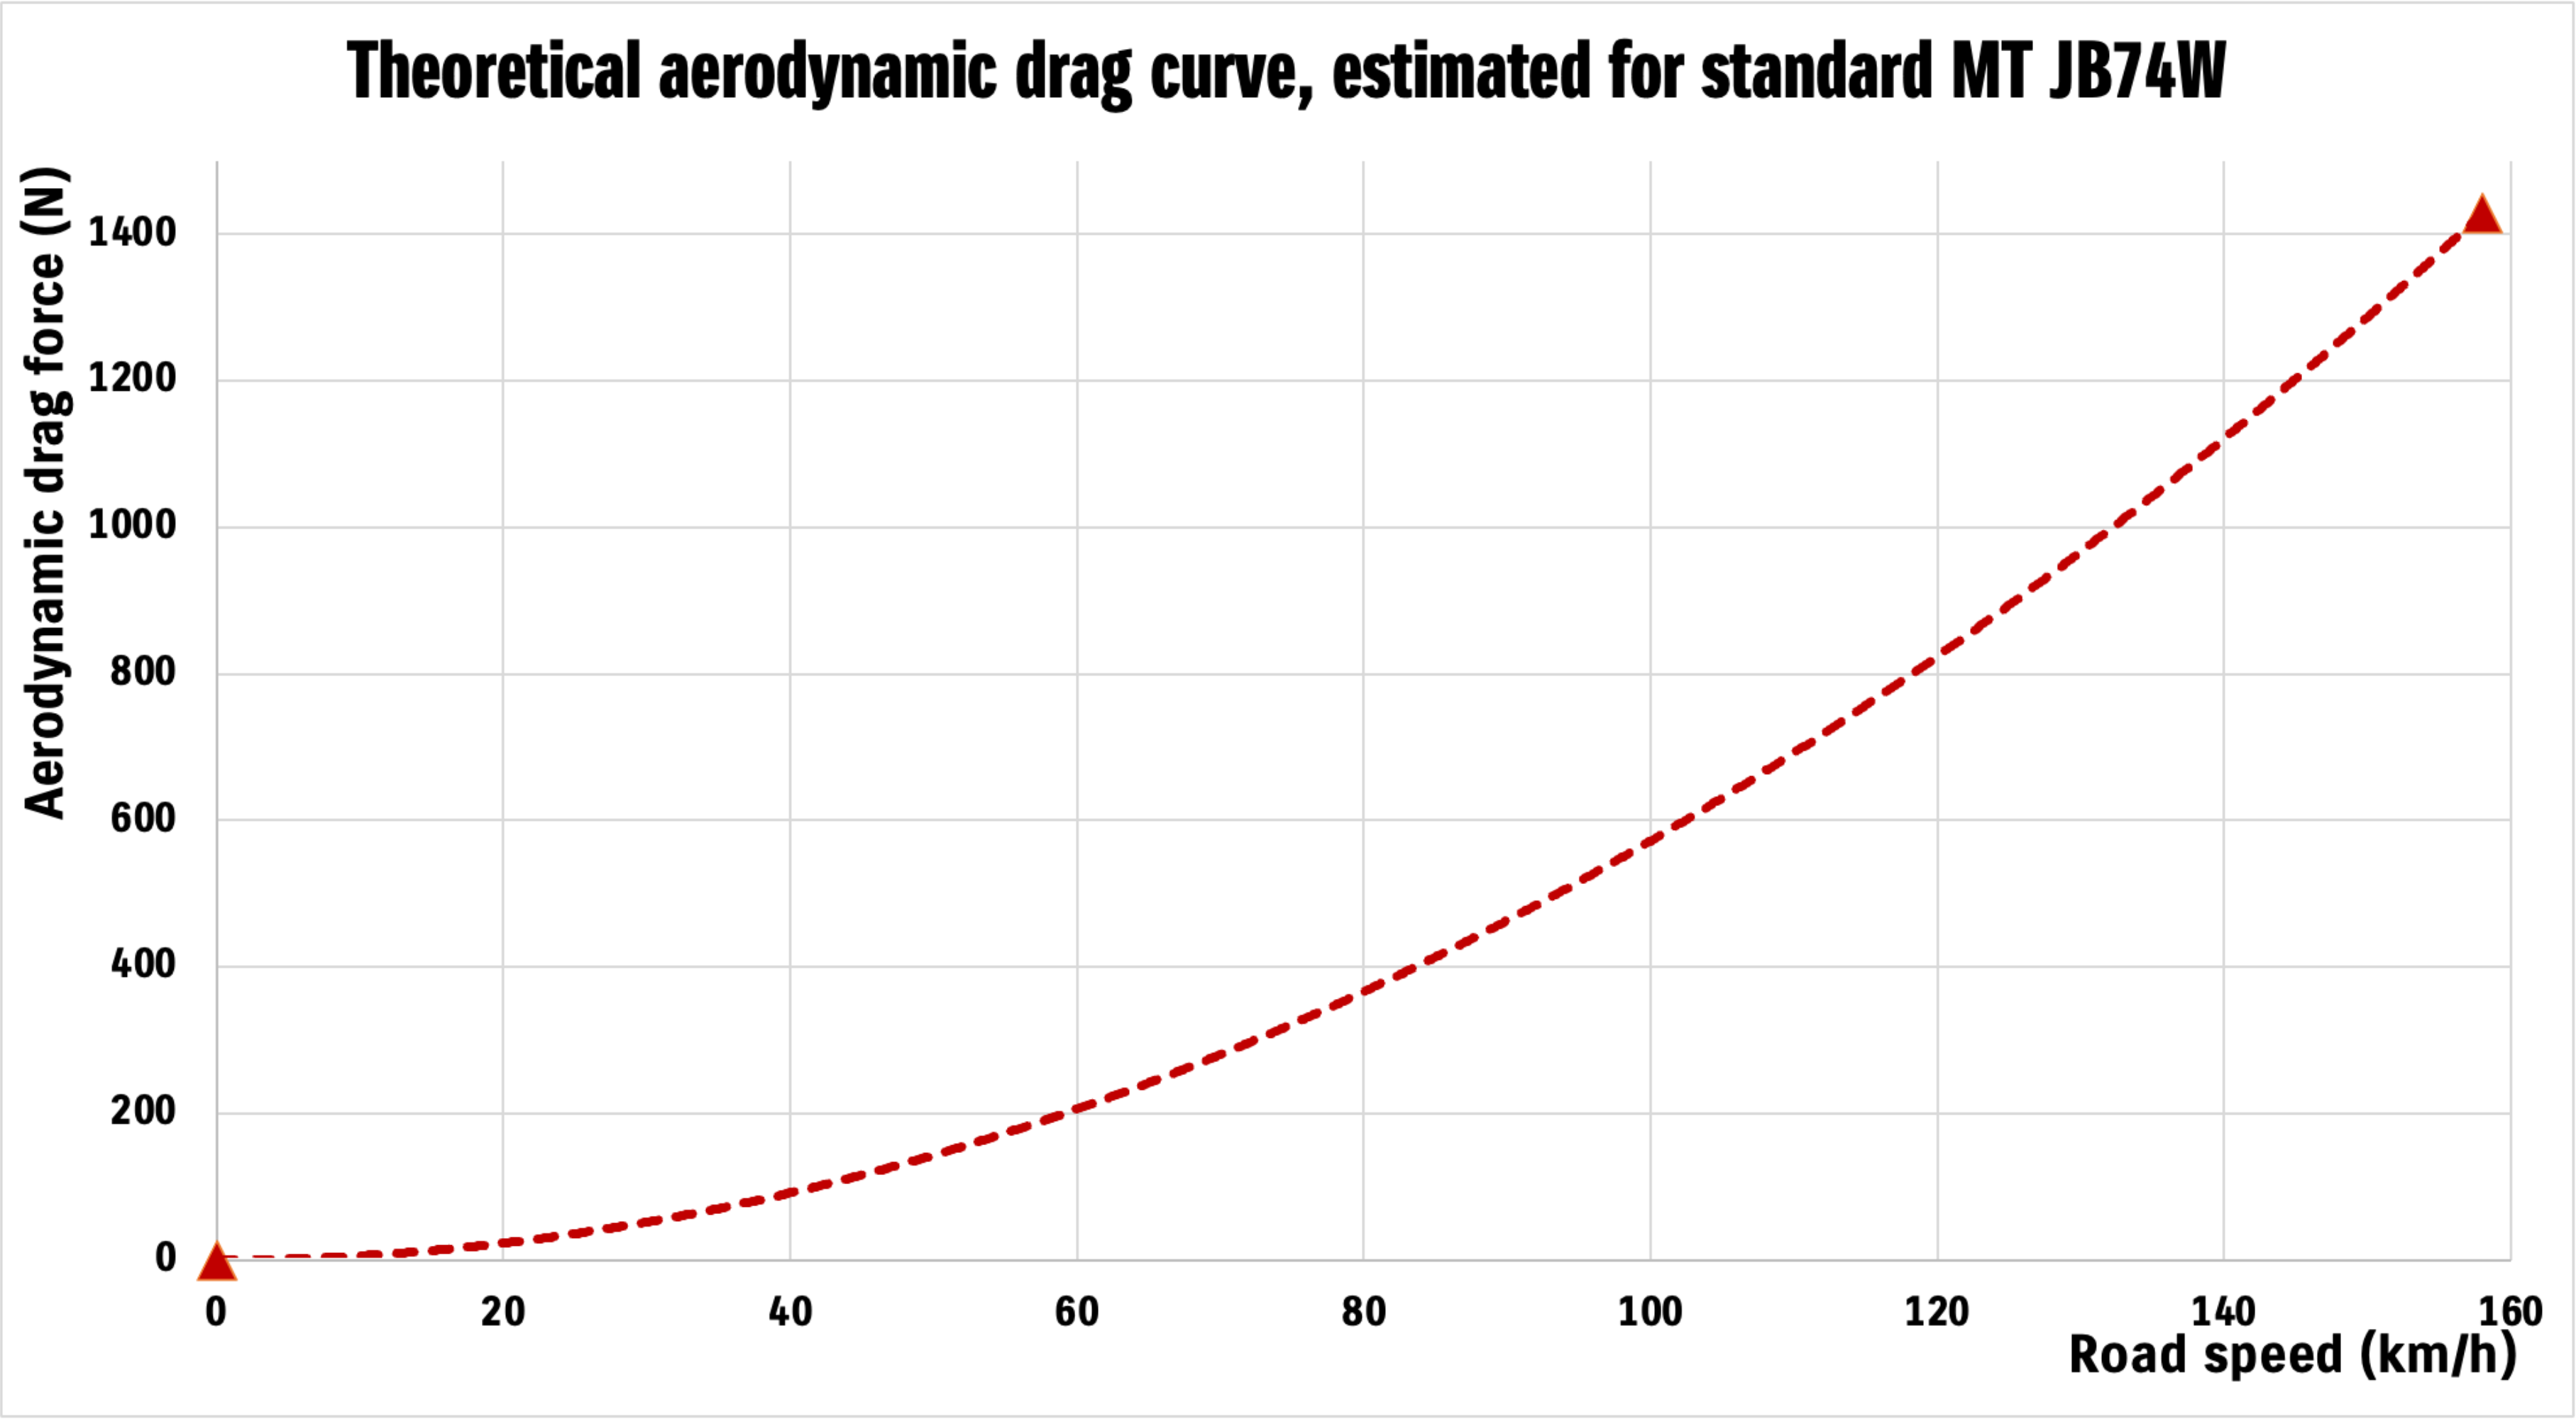
We can now look at how that fits with the apparent thrust in 5th gear. This next plot shows how quickly the aerodynamic drag force grows with speed, as I’ve started the graph at 60 km/h and end it at 200 km/h.
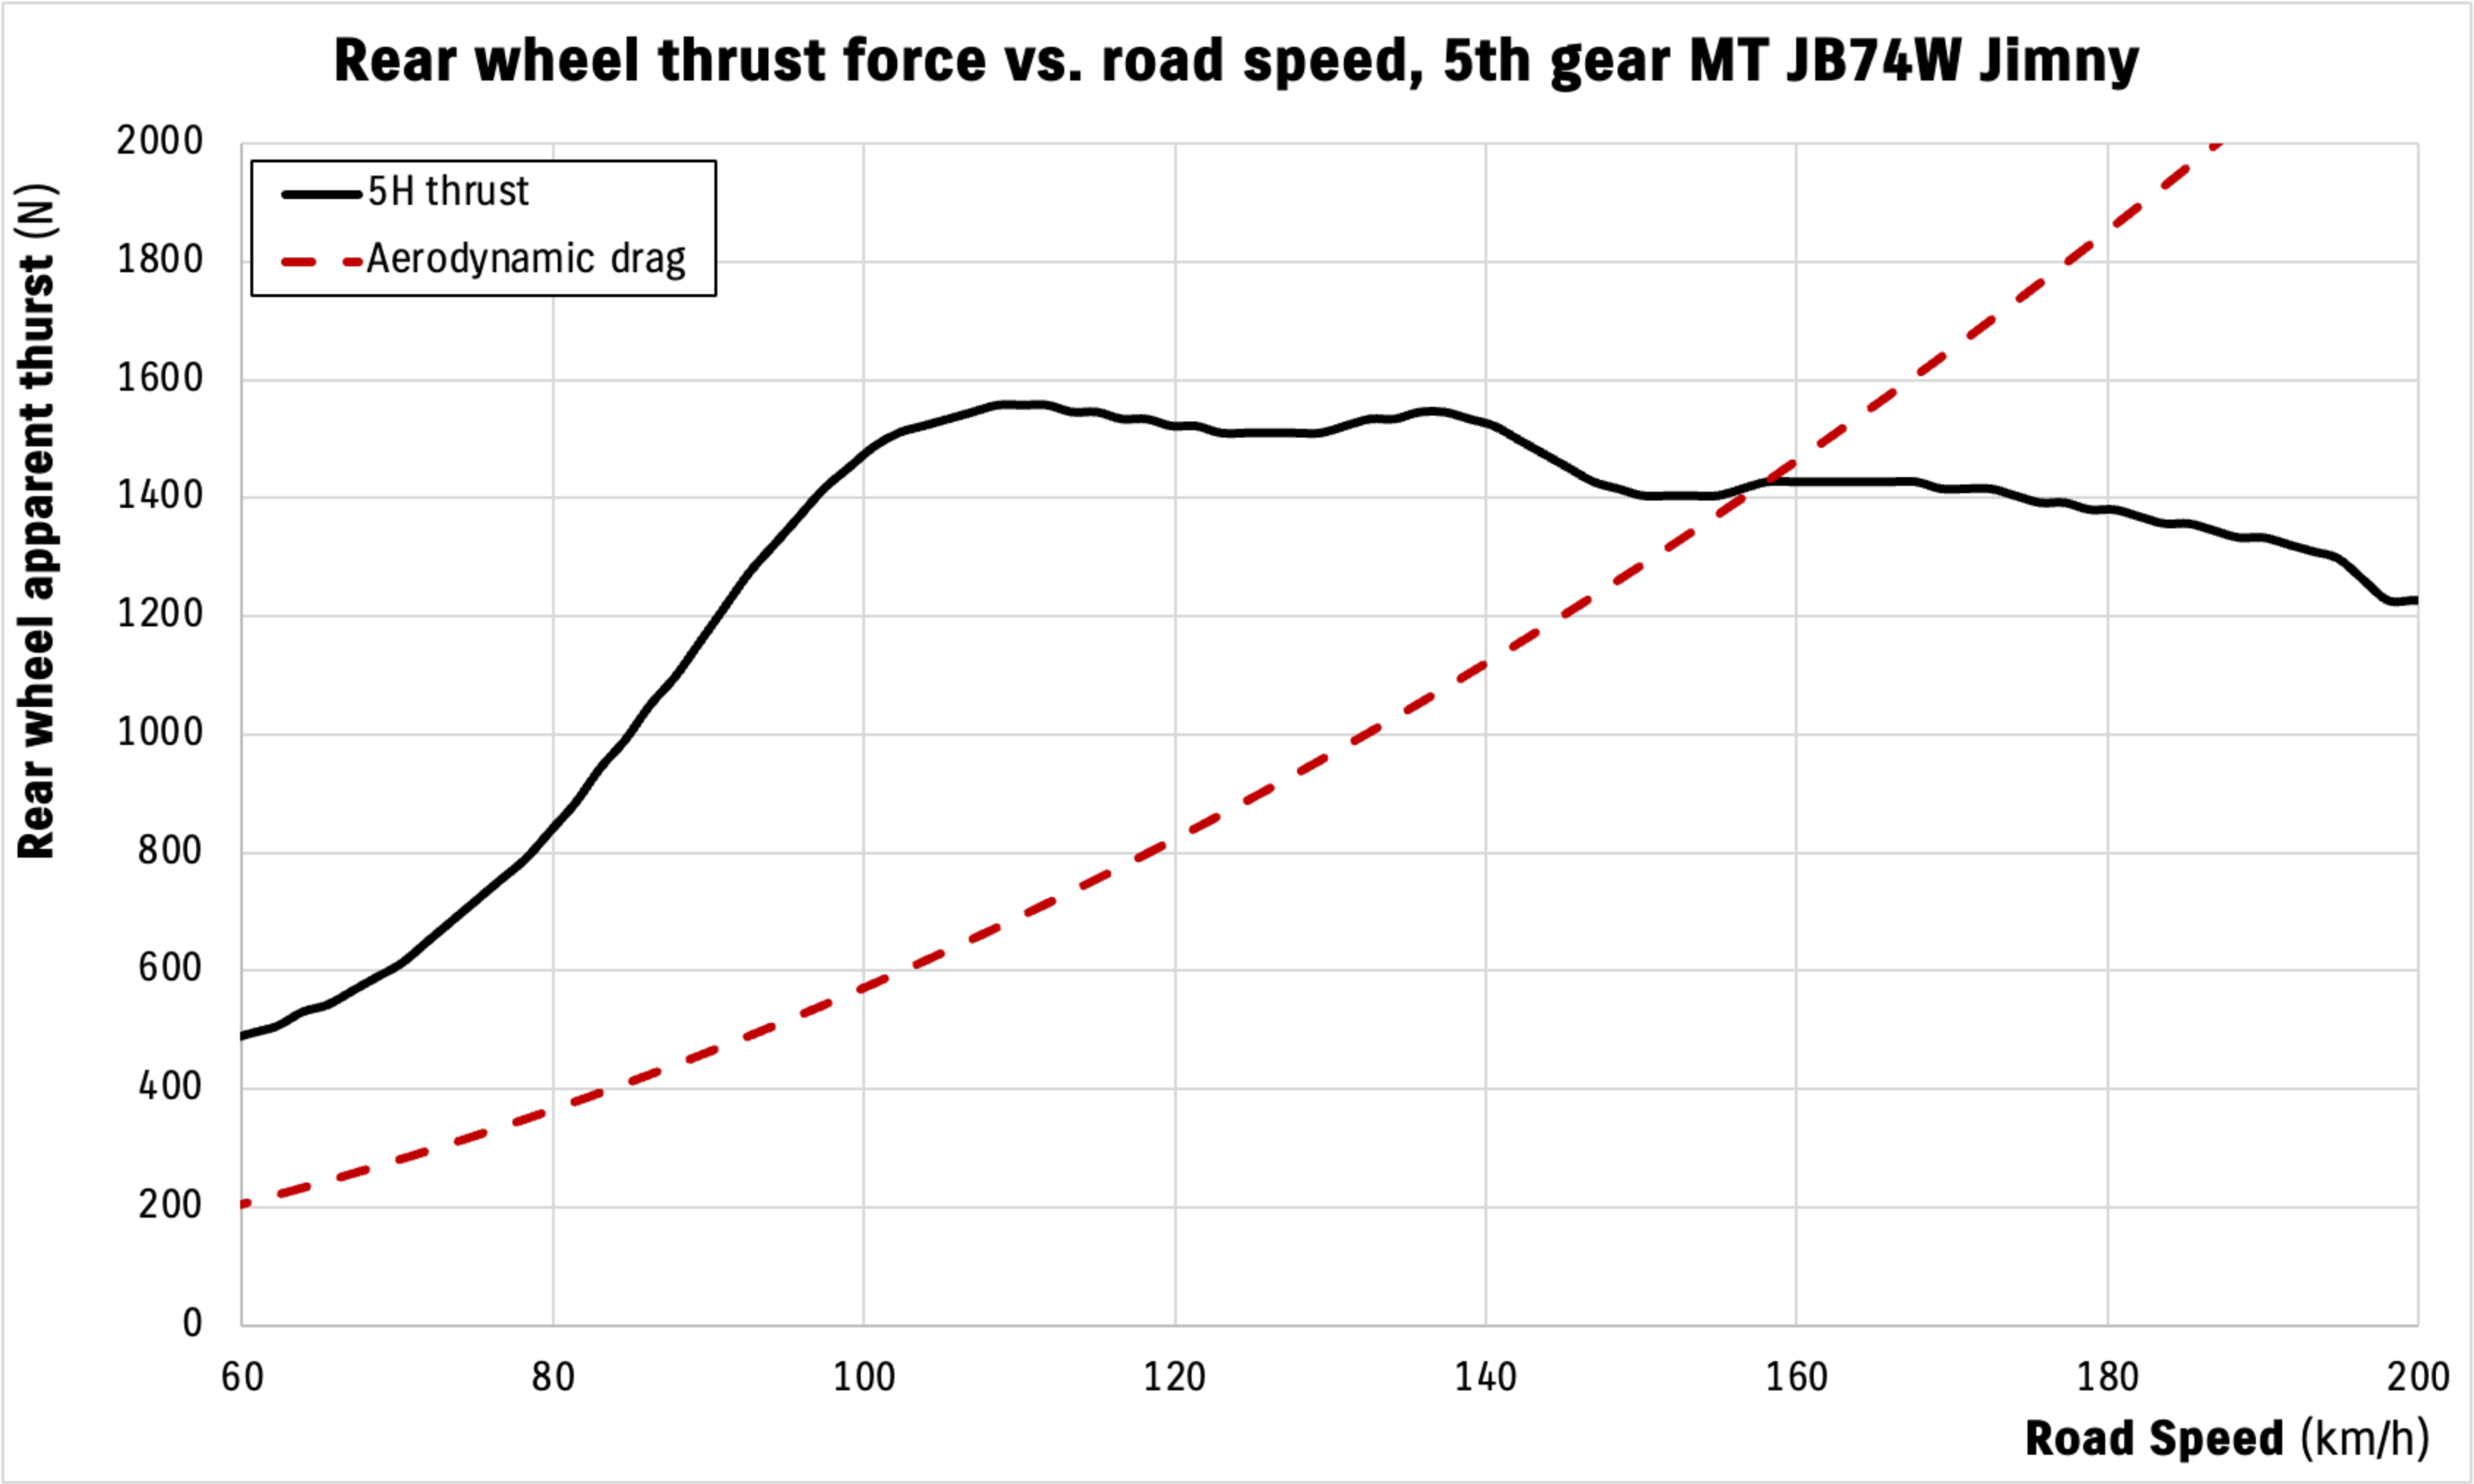
The point at where those two curves overlap is the top speed. If you were going faster than this speed then the drag exceeds the available thrust, so there is no force available to accelerate. The only way to go quicker than this is to either change the available thrust (by gaining power) or decrease the aerodynamic drag (e.g. by slipstreaming another car).
This lets us subtract this aerodynamic drag curve away from the composite thrust curve I presented earlier, and we can also do this for the automatic transmission too since its aerodynamic drag will be very similar.
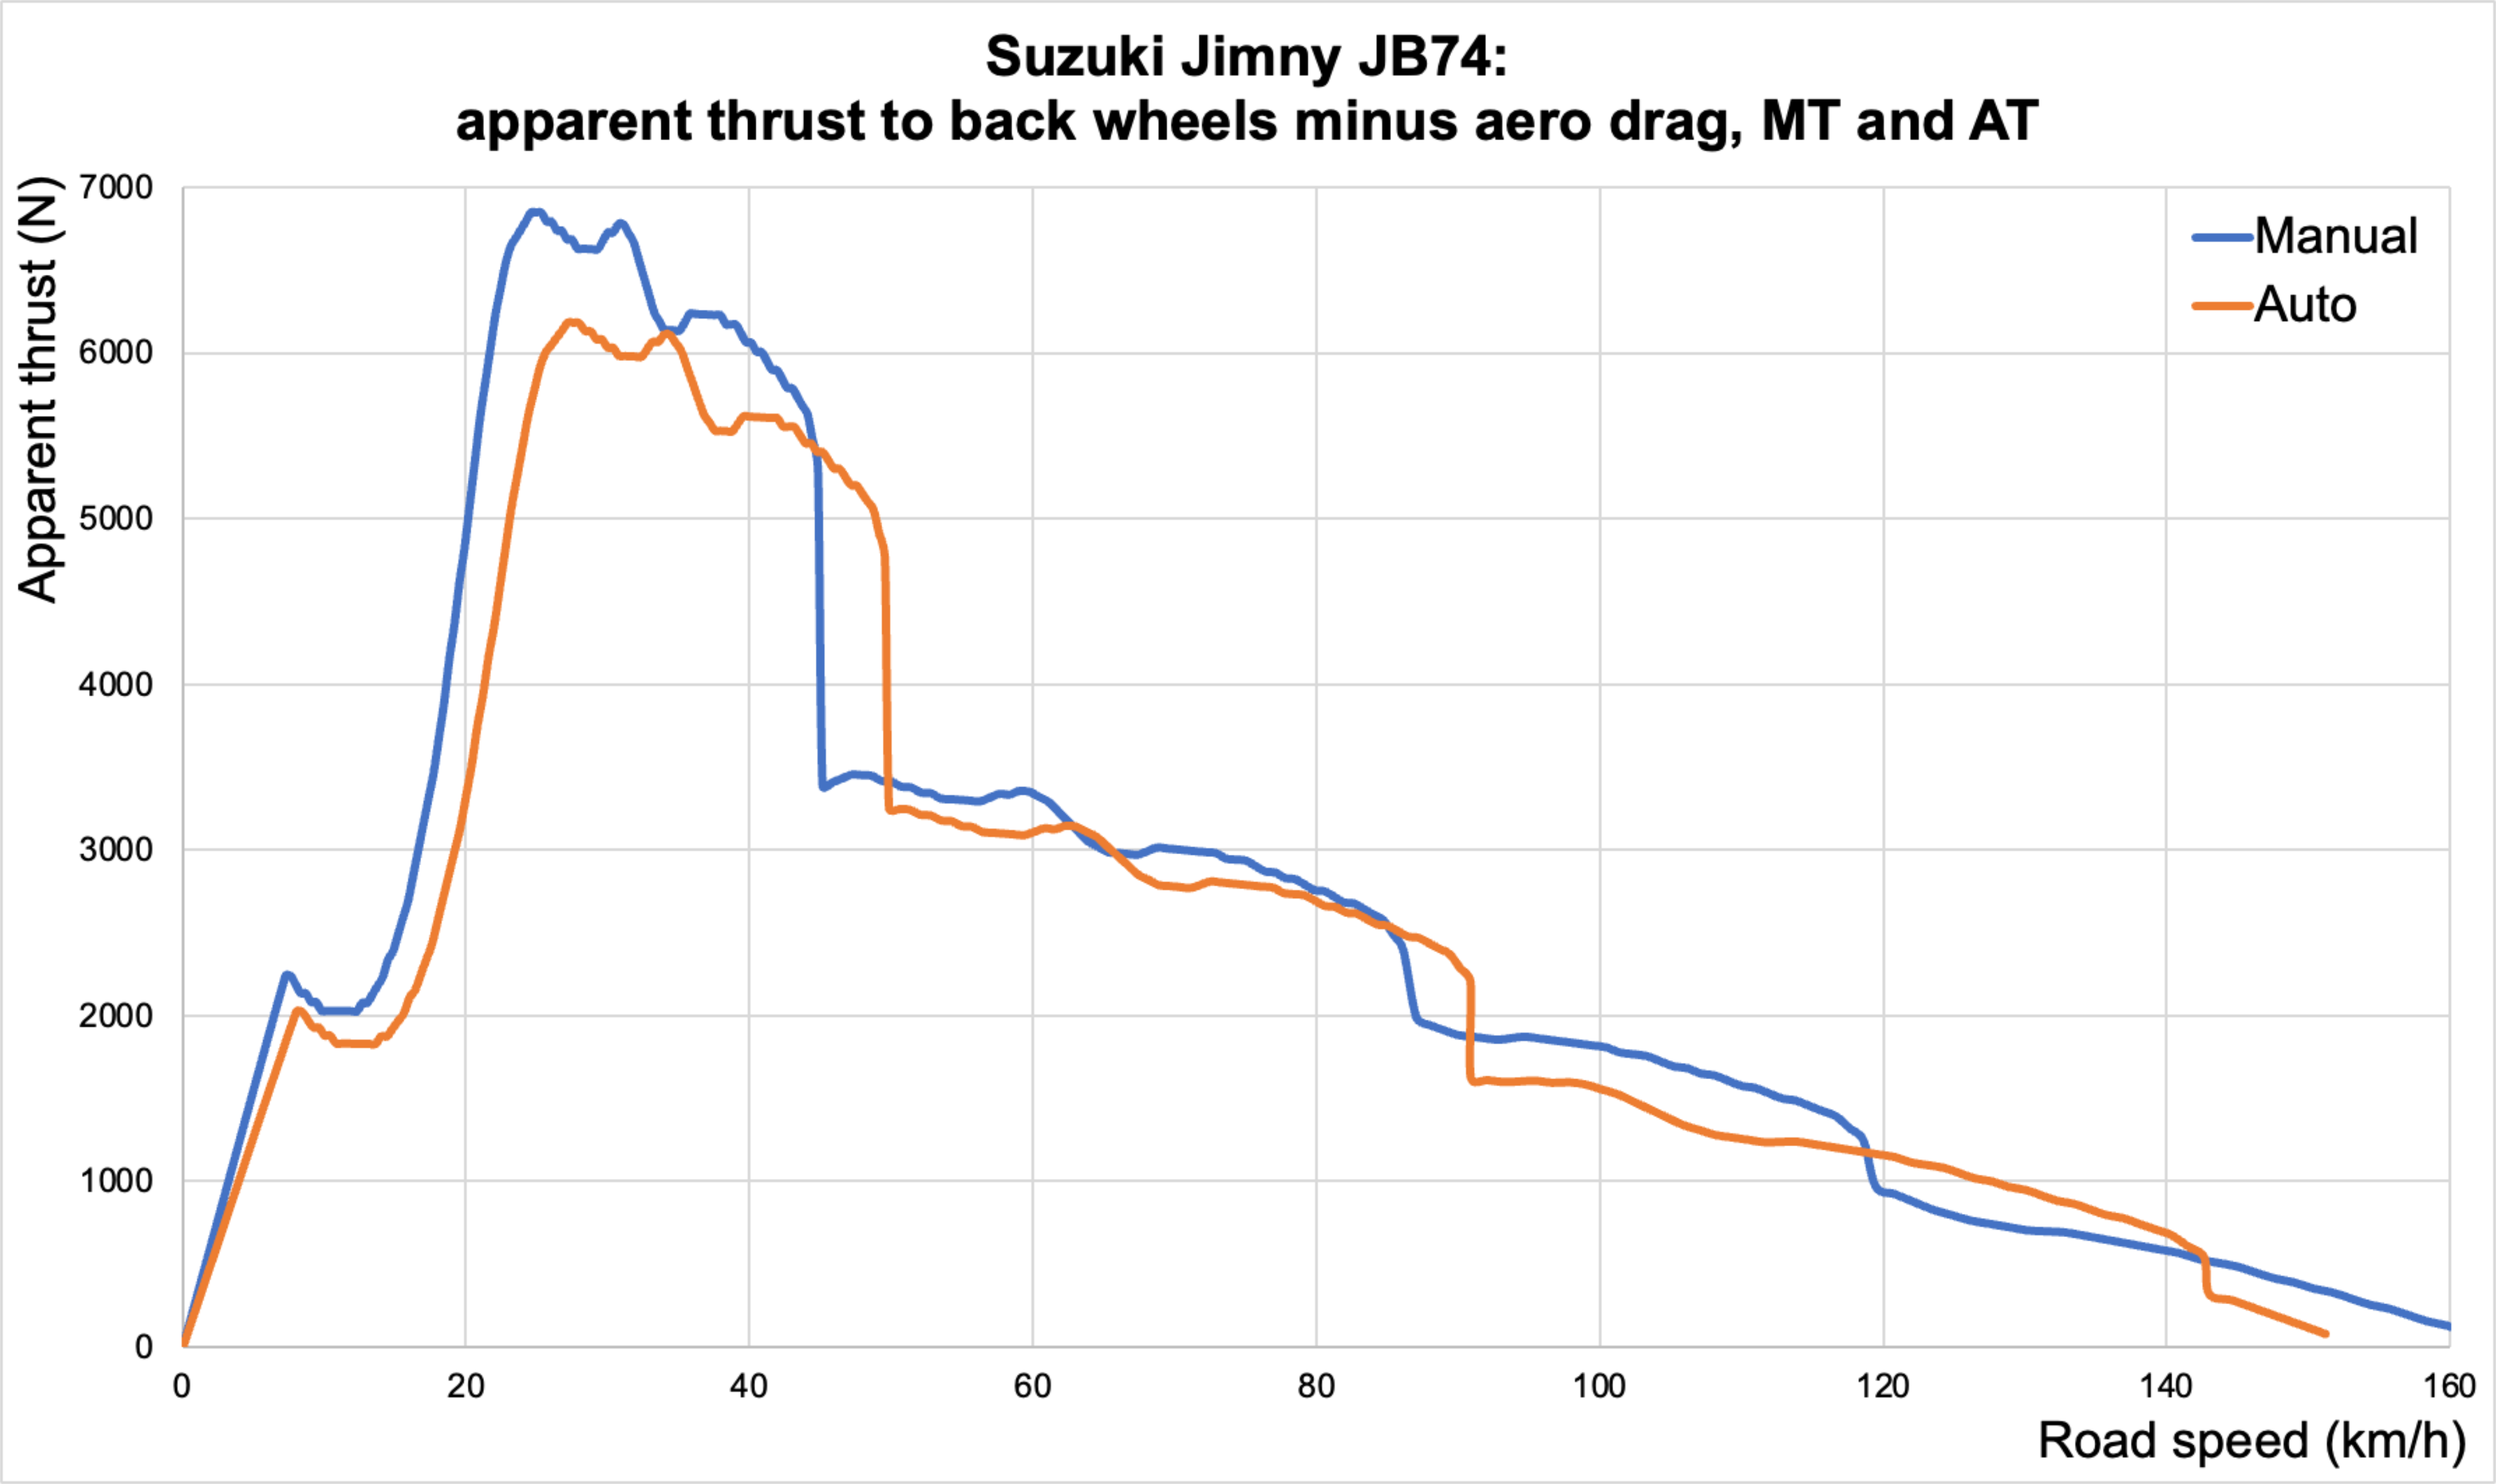
The speed at where this graph hits 0 net apparent thrust is the top speed; this means the automatic transmission hits the top speed around 150 km/h due to its slightly longer top gear compared to the manual. The manual curve, however, doesn’t hit zero at 158 km/h like we’ve been discussing… what gives?
That hits a nice little interesting aside.
Will you get to a higher top speed in 4th in a manual instead of 5th?
Potentially yes, but you’re basically going to need to smack the rev limiter. If you plot up 4th and 5th and the aerodynamic drag curve we estimated from the top speed in 5th shown in the earlier video you’ll see how close the apparent thrust is at this speed.
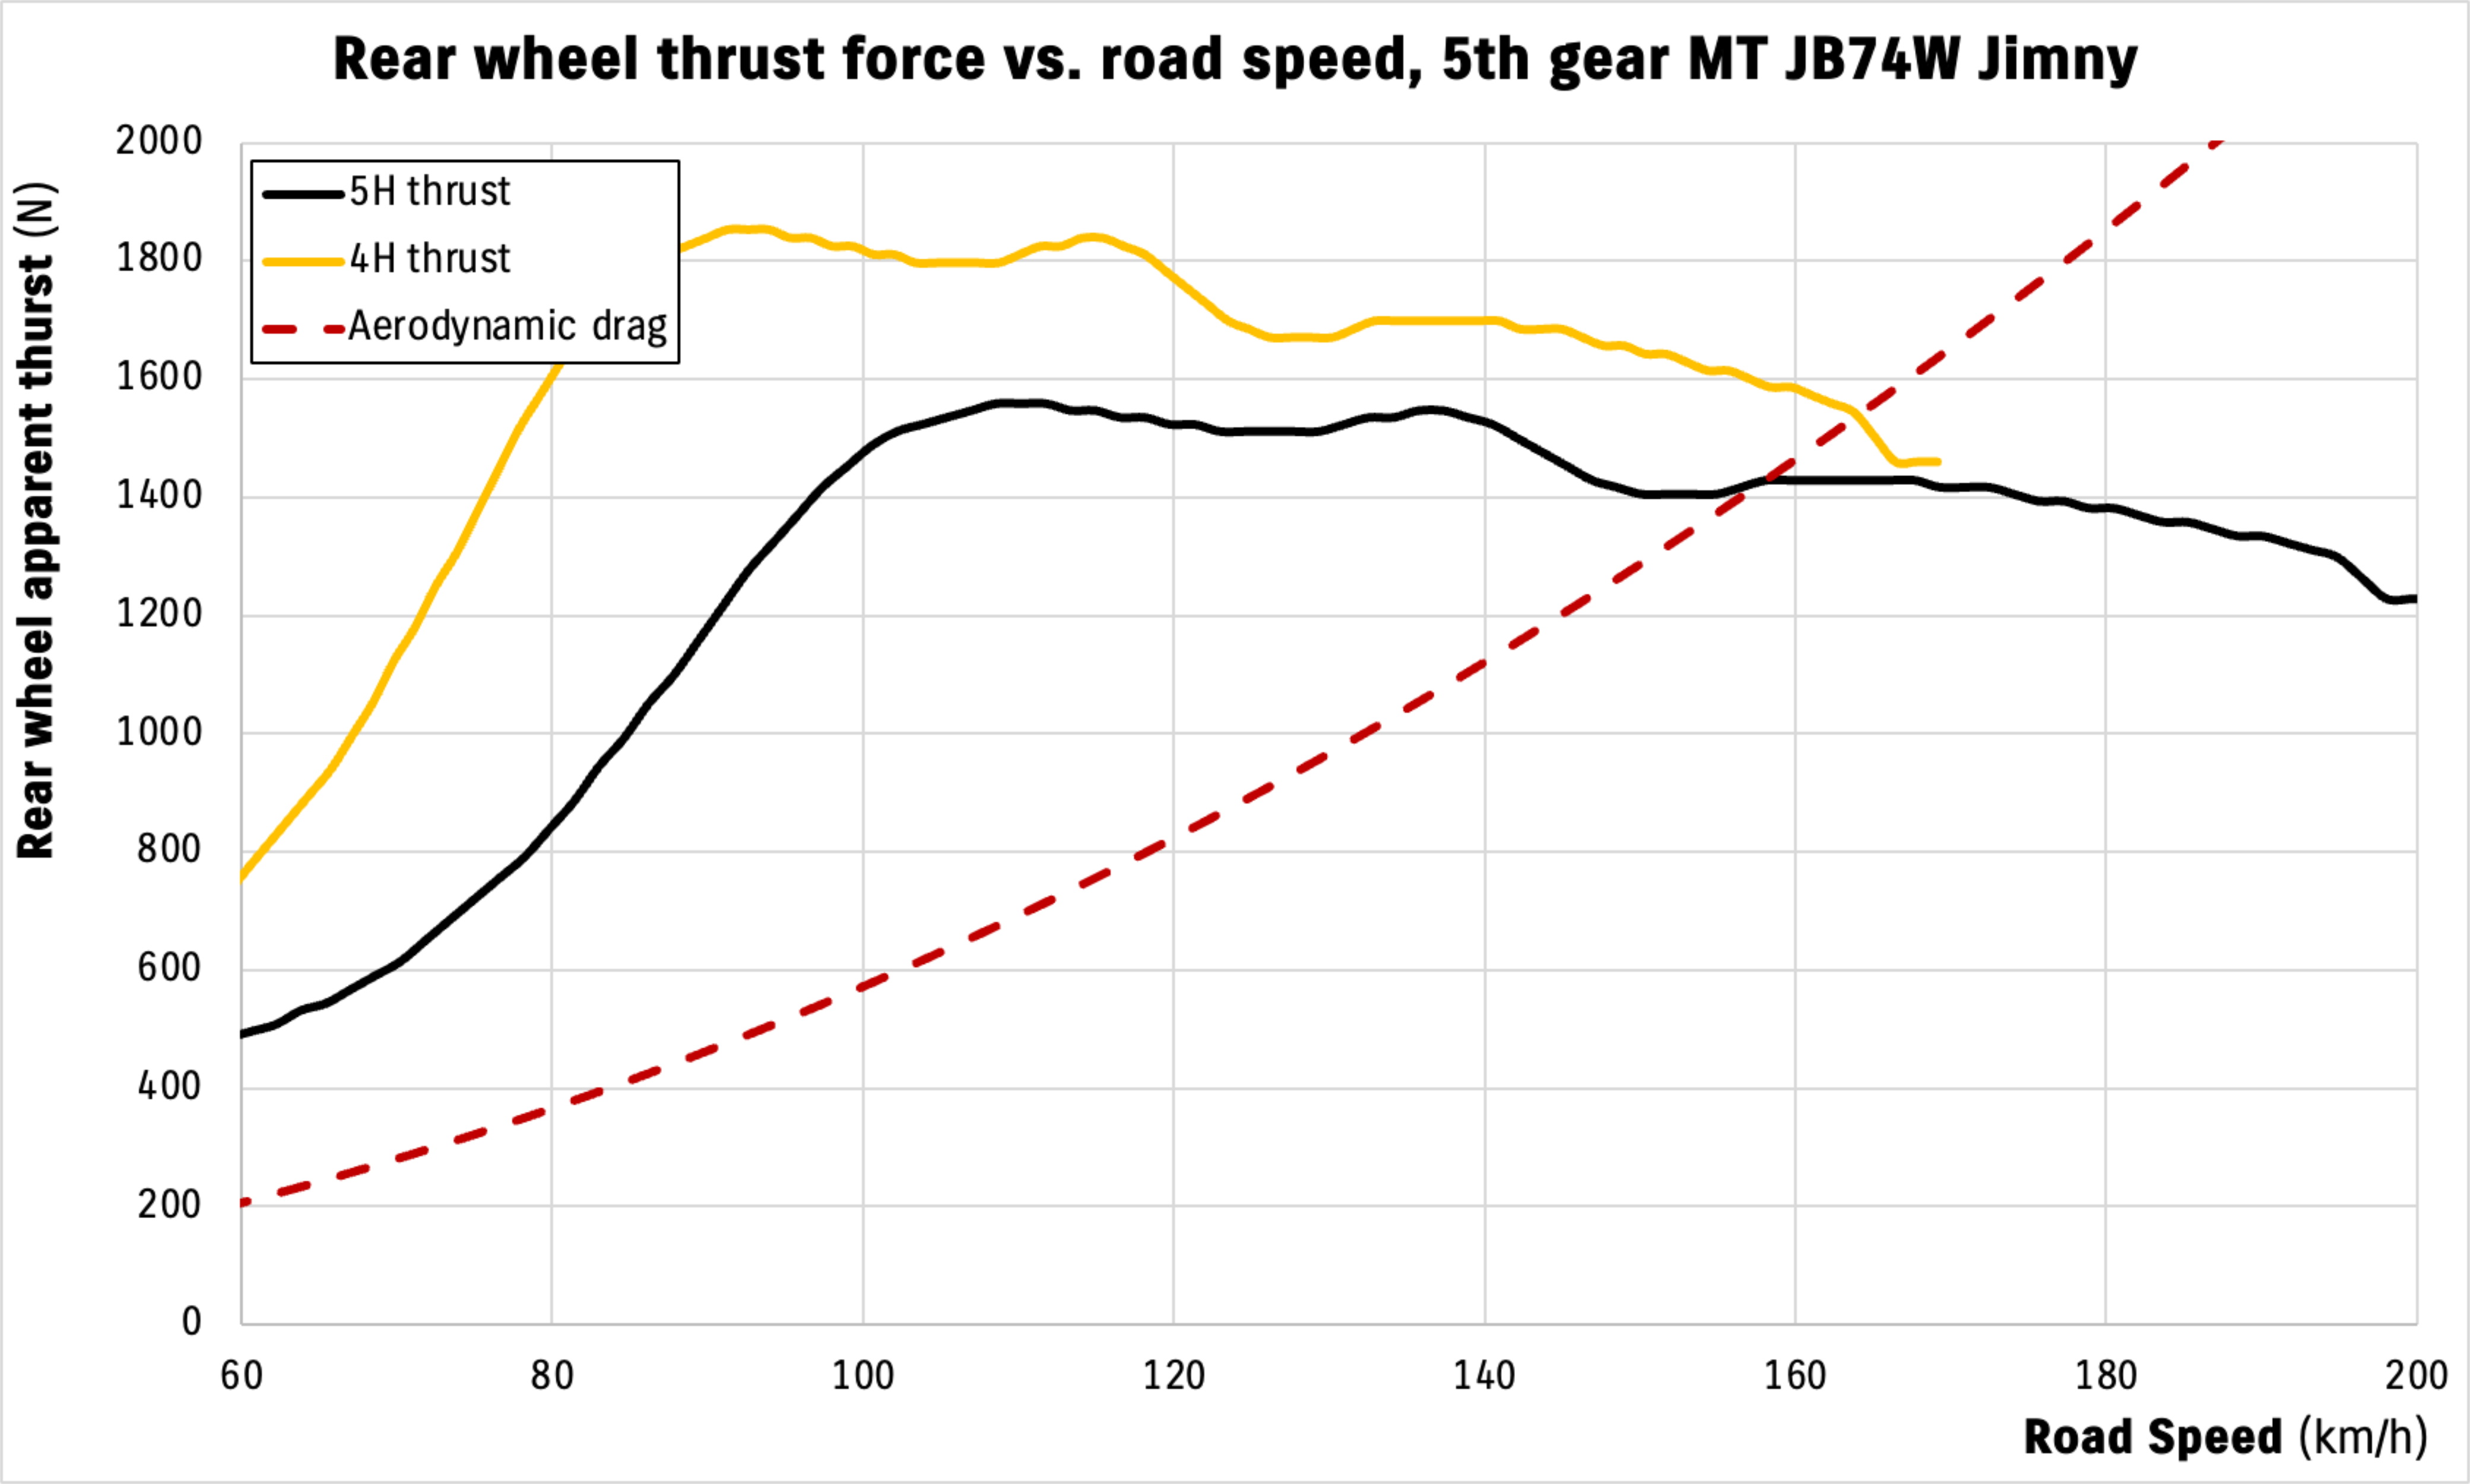
It is exceptionally close but basically you get a couple of km/h more out in 4th gear: about 164 km/h at 6110 rpm in 4th. The extra gearing multiplication of available torque in 4th gear, despite giving you more revs, just lets you access that little bit more thrust.
It’s so close it’s potentially within the error of the analysis I’ve done, since it depends on my interpolated dyno curves and a bunch of other assumptions. From a theoretical standpoint though, yes, in theory a Jimny is going to be marginally faster top speed wise in 4th.
4th will always give more thrust than 5th at speeds lower than max revs in 4th, so if you have a more aerodynamically challenged car than a standard one (e.g. roof racks, bullbar etc) then you will absolutely get more top speed out of 4th than 5th.
Gearing is a wonderful thing and it’s a pretty interesting edge case.
Could Suzuki have given the Jimny a longer sixth gear for lower revs on the highway?
Short answer is no. The above analysis should show you that a longer gear kills off the thrust provided because of the lack of torque multiplication. We can do better than that, though.
It’s quite common for people to want something that gives revs more similar to other cars on the highway. Midway up the page is a table of revs for a given tyre size and you can see there that 110 km/h in 5th gear on stock tyres is 3444 rpm. Lets say you wanted to drop that to what you think is more reasonable at, say, 2600 rpm. Surely an 800ish rpm drop isn’t too big of an ask for Suzuki to engineer into the car for better fuel economy and lower revs and thus noise on the highway, right? It’s only a 24.5% drop.
The problem is, as discussed with regards to thrust loss due to bigger tyres, that 24.5% drop in revs and gearing hurts you through both worse torque multiplication but also less torque available. To achieve 24.5% gearing change you would need an overdrive top gear of 0.755:1. That’s not an atypical top gear in a modern car, either, so we aren’t doing anything too silly.
The problem now is we get access to the torque at 2600 rpm: ~80 Nm (vs. 132 Nm @ 3444 rpm in 5th). Let’s multiply that through with our new 6th gear:
80 Nm * 0.755 * 1 * 4.09 = 247 Nm at the back axle, or an apparent thrust of 713 N (vs. 1558 N in current 5th). Yep, our 24.5% modest gearing change has netted 54% less available thrust to move the car along; a significant decrease.
Since we now have an understanding of the aerodynamic forces involved too at speed we can see how that fits with our aerodynamic drag. Using that top speed run earlier, and then accounting for the quadratic change in the drag force with respect to speed, we get a calculated aerodynamic drag force of 692 N.
Translating this practically it means we need 97% of the available power at 110 km/h with our 6th gear ratio to just maintain the speed of the car. You calculate this by looking at the ratio of the aerodynamic drag versus the available thrust: 692/713 = 97%. Basically, we’re at full throttle just to sit at 110 km/h in that gear. (The current 5th only requires about 44% of available power, consistent with the amount of pedal you need to give the car to sit on 110 km/h actual).
The picture gets worse if you look at it graphically. Here I’ve looked at the 0.755:1 ratio that gave us ~2600 rpm at 110 km/h, but also 0.8:1 and 0.9:1 to give 2755 and 3100 rpm in our hypothetical 6th gear at 110 km/h.
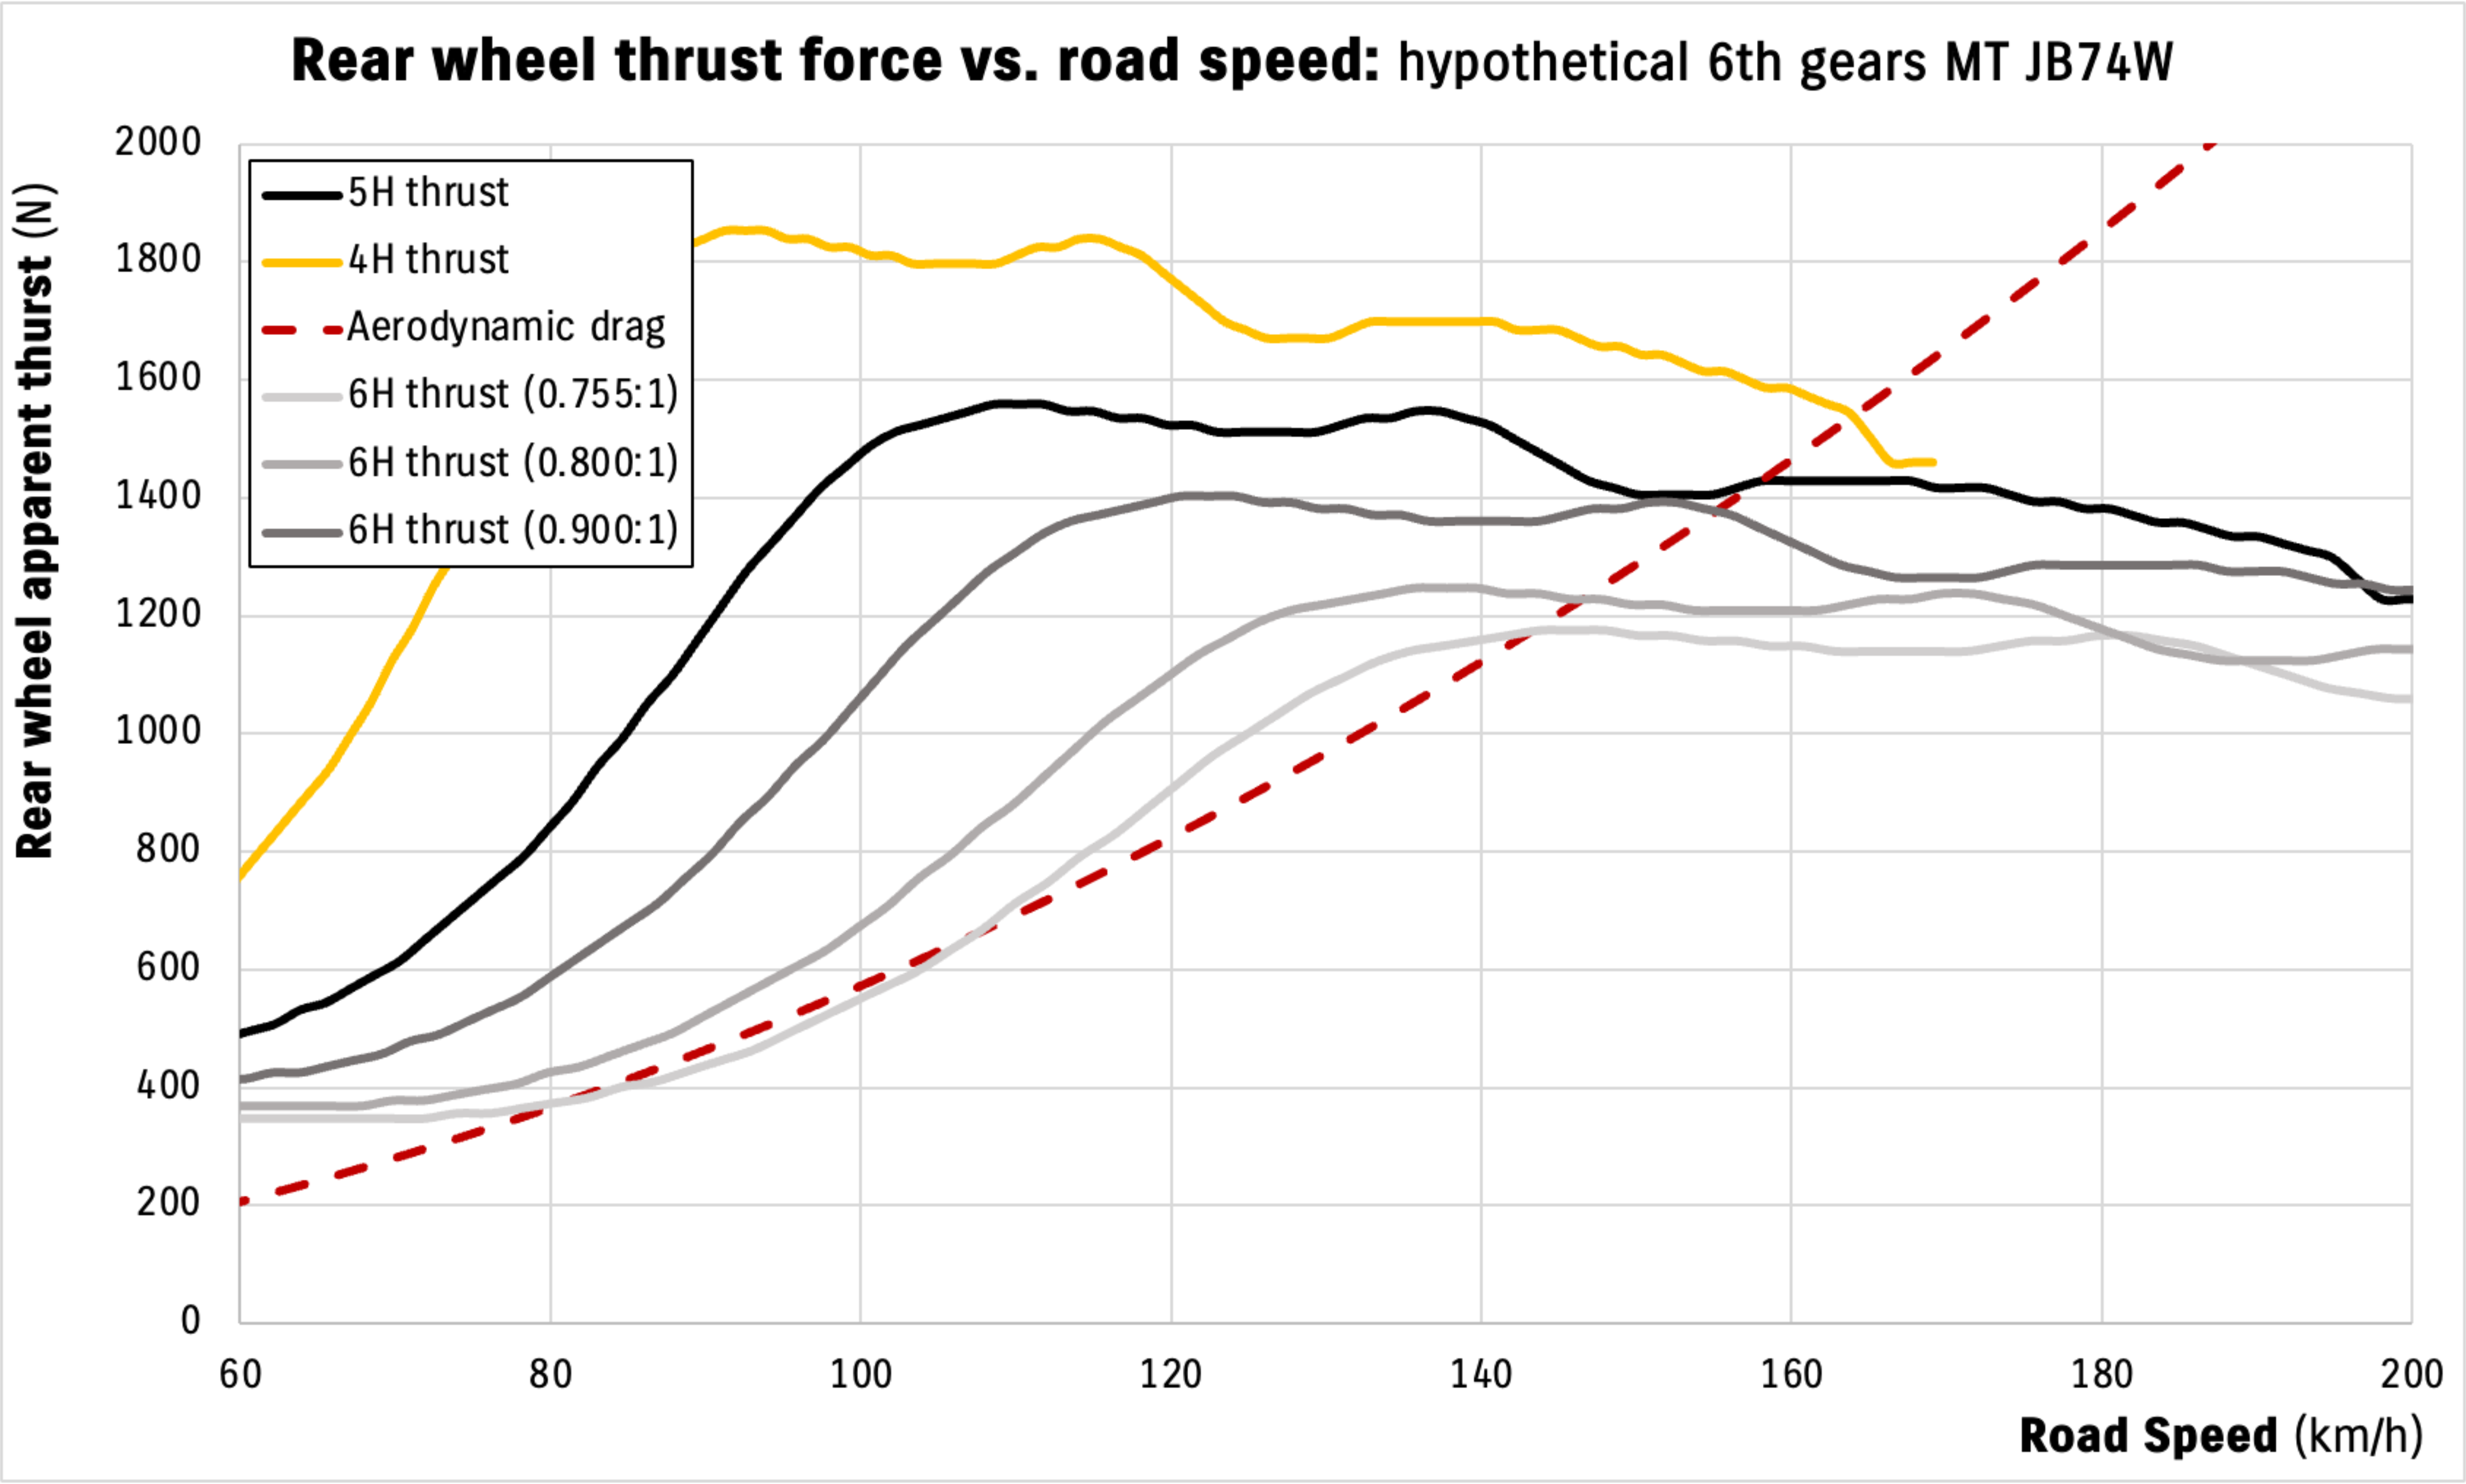
I say it gets worse for our 0.755:1 6th gear: it actually dips below the aerodynamic drag at about 80 km/h and barely gets above it at 105 km/h. So it wouldn’t even let the car accelerate on the flat until you were doing a sufficient speed. That definitely says it’s too tall. Dropping to a 0.8:1 hypothetical 6th gear it’s better, but you’re still barely above the aerodynamic drag at 110 km/h so you’d be near full throttle. 0.9:1 is better again, just starting to climb onto the better part of the thrust curve due to where the engine makes better torque, but it’s still marginal compared to the existing top gear of 1:1. (This also loops nicely back to why they suck with big tyres on them; you just are losing out on gearing and you’re falling off the torque curve all the way to the highway speed limit in Australia).
That is why I say the car can’t carry a taller top gear than the current top gear; you reduce the torque multiplication of the gearing so you have less thrust to balance aerodynamic drag requiring you to ask more of the engine, and you’re also accessing less torque by being so far away from peak torque.
If you could make the car make more torque at lower rpm then yes, it could carry a higher top gear than it currently has. Tuned cars don’t just gain power at the top end but they also have pretty reasonable gains in that 2500-3000 rpm position that cars spend a lot of time in. That would help the car, as would more ultimate power (a rising tide lifts all gears, essentially!) but without that change the car just won’t carry a taller 5th gear.
Nerdy stuff: how to calculate this sort of thing practically
People definitely have a deep fear of mathematics in general, but ratios are relatively simple to understand how they work. It’s just a case of chaining everything together. While I’ve previously written little programs to calculate this stuff, this entire article has been based off a quick Excel spreadsheet I made as it’s really straightforwards and you get get nice looking graphs out of it quite quickly if you put in a bit of work up front.
It’s not easy to share Excel sheets and it would be super annoying to convert it to a Google spreadsheet, so I’ll just give you some hints about setting it all up.
The first is to break stuff into a few tables. Give yourself an area (or even its own sheet) for the gear ratios. This can let you make it much easier to modify these cells based on gearing options to make comparisons faster.
To work out overall ratios like I did earlier, it’s easiest to think of it in terms of RPM change through each gear ratio. This is the reciprocal of how the gear ratio is written, e.g. 2:1 is actually a 1:2 change in rpm (6000 rpm -> 3000 rpm output). That will let you work out speeds in terms of rpm for an axle.
I usually do all my calculations for speed in m/s rather than km/h, so I divide those results through by 60.
Tyre diameter and therefore circumference (i.e. distance travelled per revolution) is probably easiest thought of in mm. Remember to convert the wheel radius from inches to mm (*25.4 to go inches to mm), and then add in two sidewall heights (profile as a fraction * section width in mm). Multiply that by pi and you’re at distance (in mm) it travels per revolution. Divide by 1000 and you’re there for the distance taken in m per revolution, obviously.
Once you are at the point of having revolutions per second (given an engine revolution per minute) and distance travelled per revolution in m, then you can multiply the end result by 3.6 to end up in km/h from the m/s we’ve calculated in so far.
The thrust calculation is also not particularly hard. Multiply up by each gear ratio (e.g. 2:1 with 130 Nm becomes 260 Nm at the end of that gear ratio) to arrive at the actual torque at an axle. For the length of leverage to divide through to give you force in N you need the radius of the tyre: this is where having calculated the tyre overall diameter in mm helps, just divide that by 2000 to end up with the radius in m to divide through your torque to arrive at apparent thrust.
