
Jimny used values: an analysis from the middle of 2024
Preamble and rambling introduction
Zeroth thing: this is not to justify pricing as per what people ask on Carsales; also, I’m not interested in what people *think* a Jimny is worth to them. This is about, statistically, what do the overall trends look like in Jimny pricing. If you think it should be a $20k on the road in 2024, good for you, I hope mental time travel helps you cope with the inflation that has occurred since 1998 and when Jimnys were last officially around that pricing on the road.
There’s no easy way to do this sort of analysis. Governments do not provide transfer information to allow you to do an analysis of what things actually sold for; in addition those values can be obfusticated to minimise stamp duty with private sales or because of the way cars +/- accessories get sold at dealerships.
In order to do this sort of analysis, I used carsales listings from 30 June 2024 i.e. end of financial year 2023-2024. EoFY can be one of the more active times in the used car market; more active times in markets often mean more overall robust sets of pricing. You do need to appreciate that the input data will be biased no matter how I choose to do it, but the hope is that you have enough samples to average all those biases out to allow you to draw conclusions.
To emphasise a point many people will shout at me when they read this: this is based on listed price, not eventual sales price. There’s just really no way to track that. I have referred to Redbook values in the year by year comparison to give a bit of a snapshot of how a different analysis comes out, and some of the Redbook data is informed by prior sale information reported by dealerships and some government reporting of sales.
This article is not here to analyse new costings or explain that, you should read my writeup on buying a new Jimny that goes through a breakdown of that and explains RRP and then potential on-road costs to consider. On the topic of on-road costs: to make this even between dealerships that potentially list with all on-road costs covered and private sales which do not have that built into the pricing, I have done this analysis before on-road costs are considered. I haven’t qualified registration length in the pricing variability, but potentially there could be $1000-2000 of stamp duty plus up to a year’s registration (so nearly another $1000) on top of the prices shown here for people buying a used Jimny. Finally, using before on-road costs allows me to analyse an estimated price for a car with 0 km to compare to the original RRP which is also exclusive of on-road costs.
Europeans: don’t give me grief that I’ve used commas in numbers. It’s the more readable form for the majority of my audience. kthx.
High level conclusions
- While people generally have some weird concepts around what a Jimny should be listed at, on average they show pretty reliable trends
- In gross terms they have not depreciated much from RRP
- Automatics hold their value over manuals more than their initial purchase price would suggest
- Higher km isn’t necessarily hideous for values even 6 years into the model’s run; depreciation costs of ~6 to 15¢/km when looking at vehicle values in a year and transmission grouping
- There are limited lites for sale: potentially not many sold so fewer on the used market
- There are a lot of low km, ex demo or new 2023 stock 5 doors available on the market, and they can be cheaper than 3 doors (and faster to get, for autos)
- Qualitatively (too hard to analyse for) colours don’t make a massive difference to list price so buy the one you like and can afford
The dataset
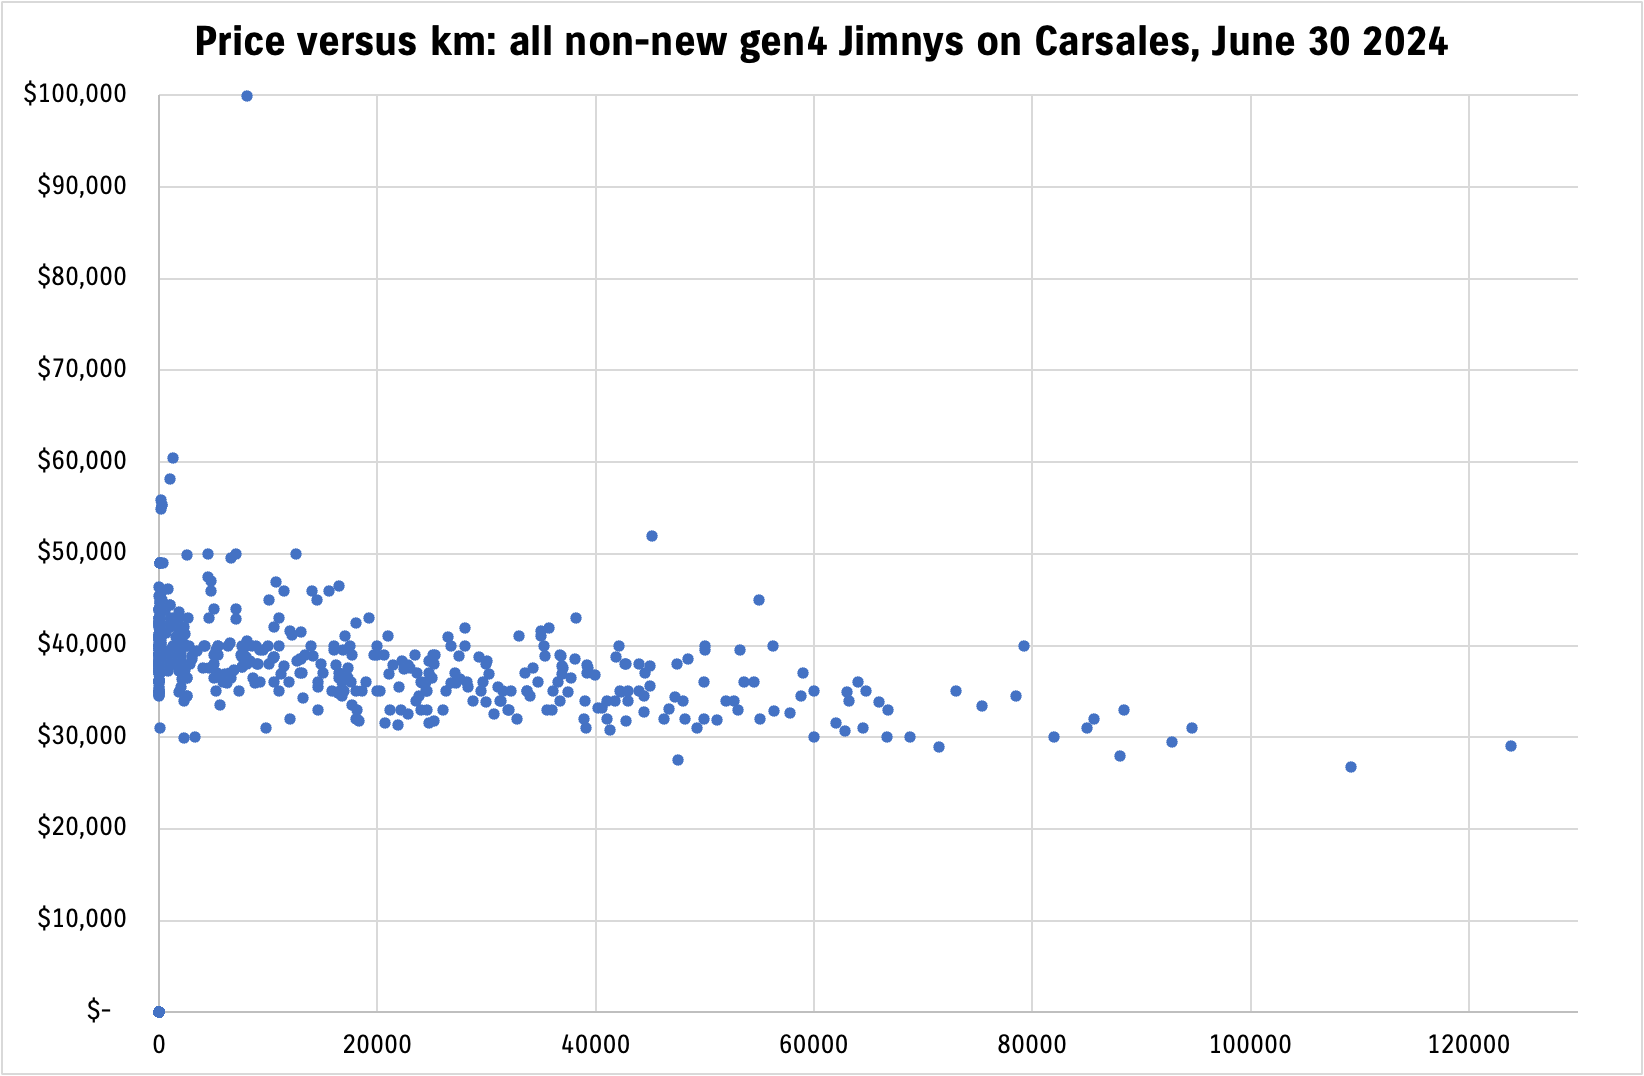
569 gen4 Jimnys listed on Carsales; some are new with no listed price (they’re the 0,0 points in that above graph)
Some statistics
- 569 cars listed: 286 automatic (50.26%), 283 manual (49.74%).
This correlates quite closely with the demand for transmissions being roughly 50-50 (based on a comment by Suzuki Australia CEO that I’m too lazy to reference). - 405 cars are listed by dealerships (71.2%) versus 164 (28.8%) from private sellers.
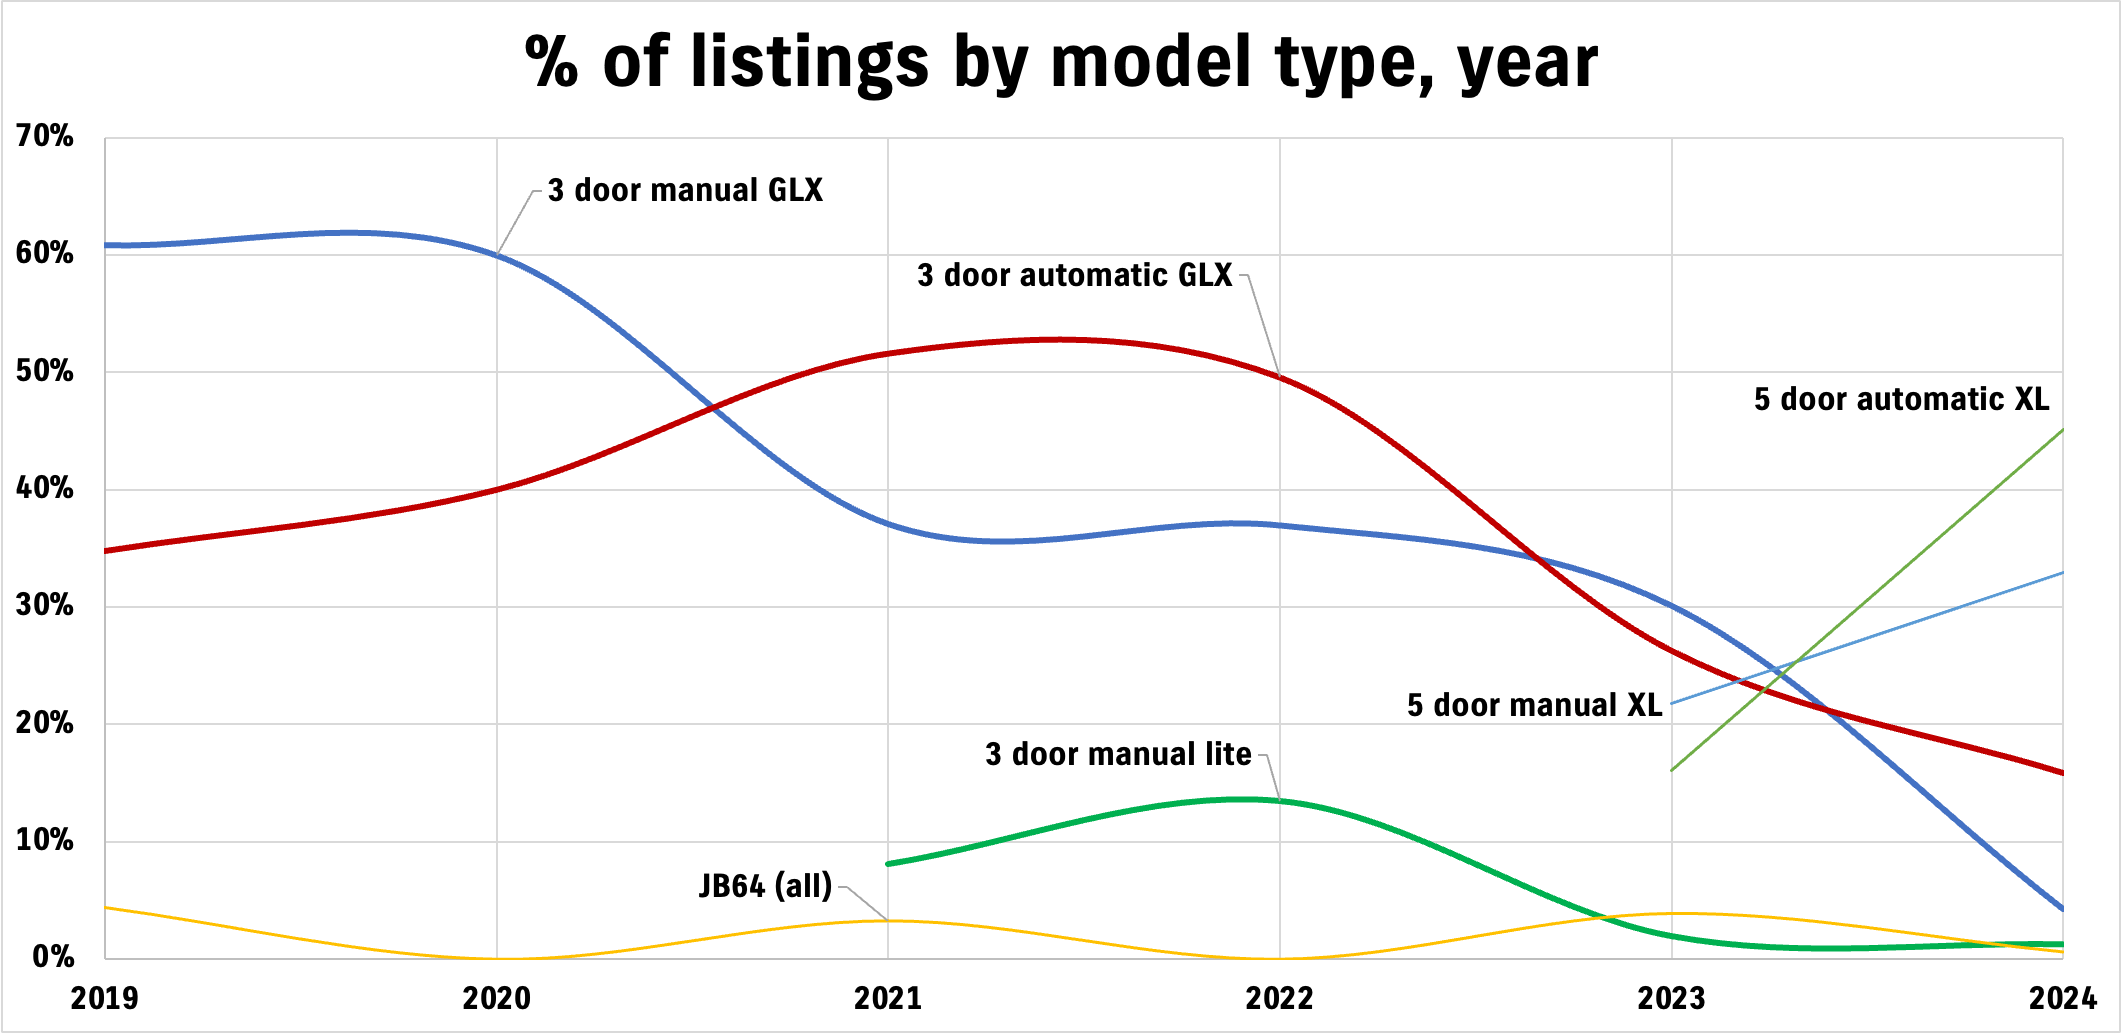
Contrary to popular belief private sellers are not asking markedly huge numbers, although they do tend to ask very high prices for modified vehicles. - 3 doors make up 67.14% of all up for sale, 5 doors 32.86%.
By the time we get to 2024, however, almost all cars listed are demo or new in stock 5 doors (~75% of 2024 listings!) Considering how many more 3 doors have been sold compared to 5 doors that is a considerable difference. - There are 10 JB64s listed out of the Jimnys for sale as at the time of analysis (1.75% of all listing).
As Jimnys are one of the cars for which there is crash test data to prove they can pass the more stringent side-impact tests brought into force in 2021, these imports are able to be made even on current cars out of Japan. If Jimnys become available only as a commercial-vehicle 2 seaters due to the New Vehicle Efficiency Standard then it might be that JB64s become more attractive to personally import. - At time of writing, listings of cars ranged between 1 and 2% of all cars sold for a given time period.
I left in the zero priced and/or zero km cars for graphing; however, for overall statistics and pricing analysis I excluded cars with no price listed.
| Statistic | Odometer listed (km) | Listed price ($) |
|---|---|---|
| Lowest | 5 km (94 cars with 0 km) | $26,800 (29 listed with no price) |
| Highest | 123,888 km | $99,888 |
| Average | 16,434 km | $38,451 |
| Median | 5,406 km | $37,989 |
| 25-75% range | 29 – 25,183 km | $34,490 – $40,095 |
While there are more manuals for sale from 2019, progressively they tail off and especially once 5 door sales come in.
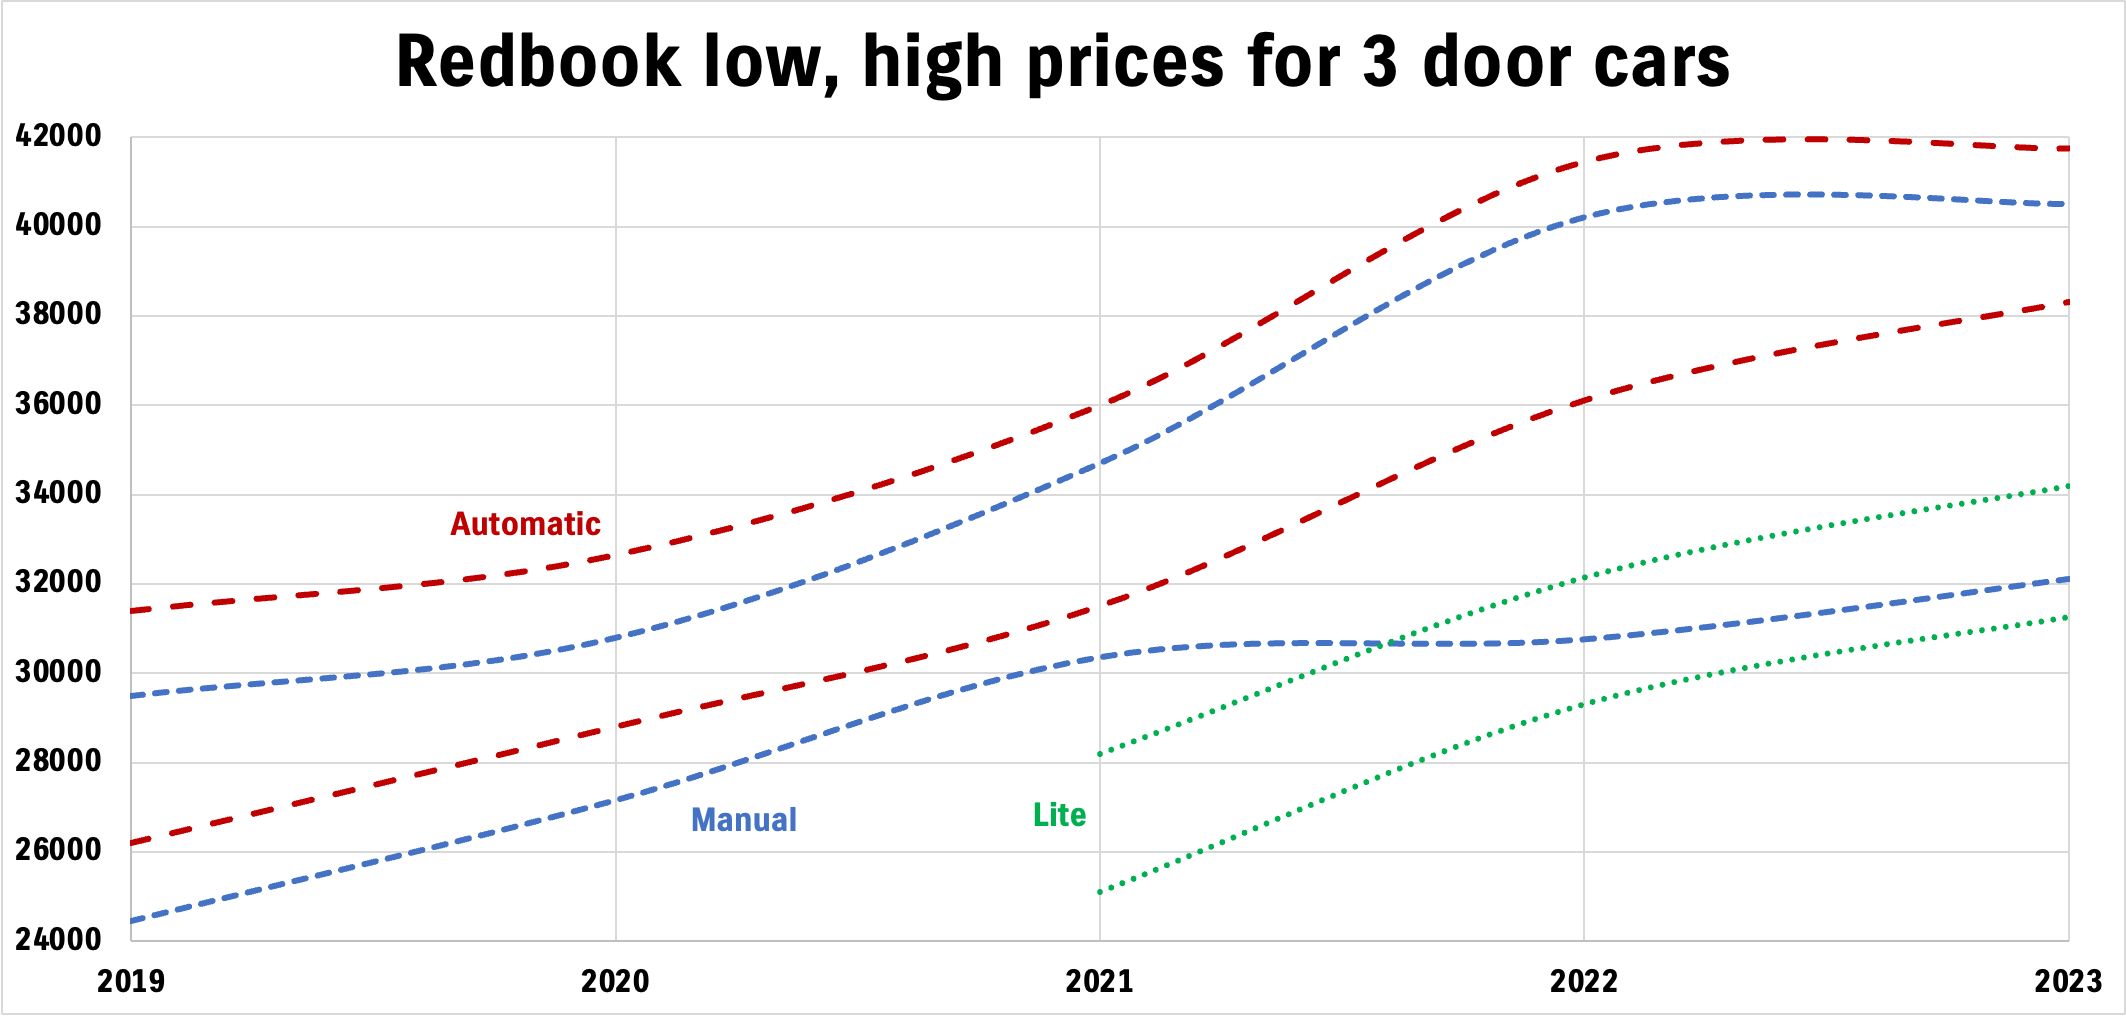
Redbook data for private sales also helps set the scene for the following analysis: automatics have strong resale value compared to manuals, and lites are below GLX specification cars especially higher end manuals in 2022-2023 sales data. Interestingly enough (not split out here) Heritage edition cars are ranked lower by Redbook, presumably as fewer cars are sold. Anecdotally they seem to trade for roughly the same price as manuals, although people often begin by asking for higher prices as they are more limited edition.
The following plot is quite messy but it’s looking at how average prices (measured two ways: a standard average via the mean, and then a median to try to remove the effect of egregiously priced outliers) trend over model years.
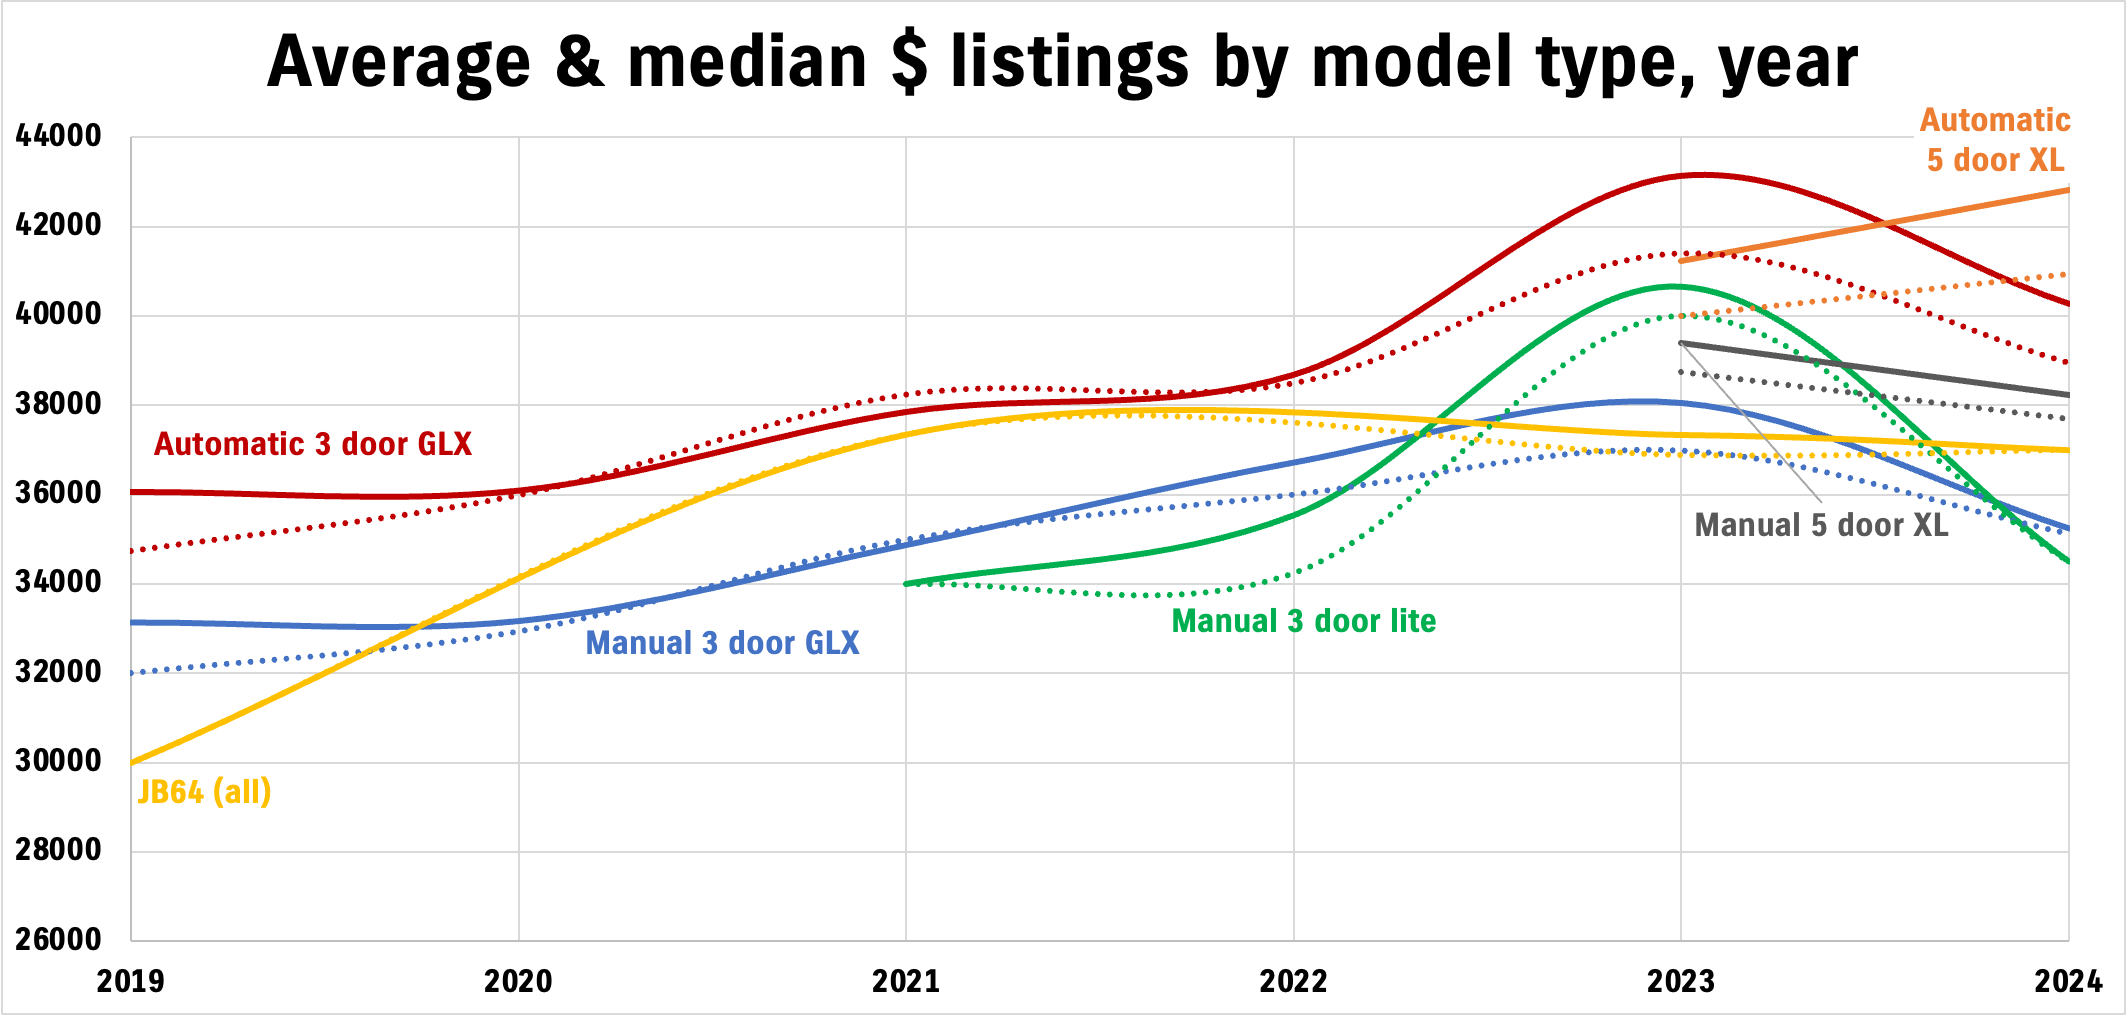
- Autos definitely are stronger than manuals, and consistently so. Roughly a $3000 price premium for an automatic versus an equivalent manual when viewing 3 door data; 5 doors are skewed by ex demos with all the fruit for 2024 model years.
- Lites are generally below GLX specification manuals, however, there are a number of modified lites for sale listed at higher prices which pushes the average up a bit.
- 3 door automatics from 2023 i.e. in stock and available now seem to be priced above 5 door automatics that are also in stock/available. There are much more 5 door automatics available than 3 door automatics, even just taking into account cars which are available now. This is doubly true when taking into account the shorter lead time of 5 door cars.
Year by year analysis
Methodology
Before we jump into this, some methodology. I grouped data by model year, model and transmission (i.e. 2021, 3 door GLX, manual). To analyse trends in the data I’ve also used some linear regressions to provide a best fit and simplified model of depreciation costs and the theoretical 0 km value of the car. This lets me look at how different transmissions are e.g. is there more of a depreciation cost for one transmission type or another, or how has their initial RRP translated into the cost projected back to 0 km based on the depreciation trends.
I did not analyse 2024 as it’s dominated by either new car listings or ex demos which have values all over the shop. Ex demos in particular can end up with a bunch of mods thrown at them and listed at a purchase price *higher* than the sum total of a new, in stock car + all those mods. That’s just one of those marketing things to get people in. A particular car example only needs to be sold once so it only needs to find a 1 in 20 million type purchaser. Analysing with those data left in would produce spurious results; removing them is also problematic as it’s hard to quantify.
Carsales also do not report colour data particular well so I haven’t checked for the values per colour. Anecdotally as I was going through these cars I did notice that there overall isn’t a trend for particular colours to be worth more. The analysis against base RRP is based on a white car for that transmission type for that year as it’s a simpler analysis. Where price rises occured during a year I made a judgement call based on sales data
I didn’t do analysis for relatively rare or uncommon cars such as JB64s or where there were limited year examples (e.g. 2021 lites). 5 door XLs are also dominated by near new demos and so are harder to analyse for depreciation so I didn’t bother. I may revisit this analysis in 18 months time at which point there should be sufficient 5 doors to draw some conclusions from.
Year by year analysis
2019
23 cars listed (4% of listed; 1.65% of 2019 cars sold new)
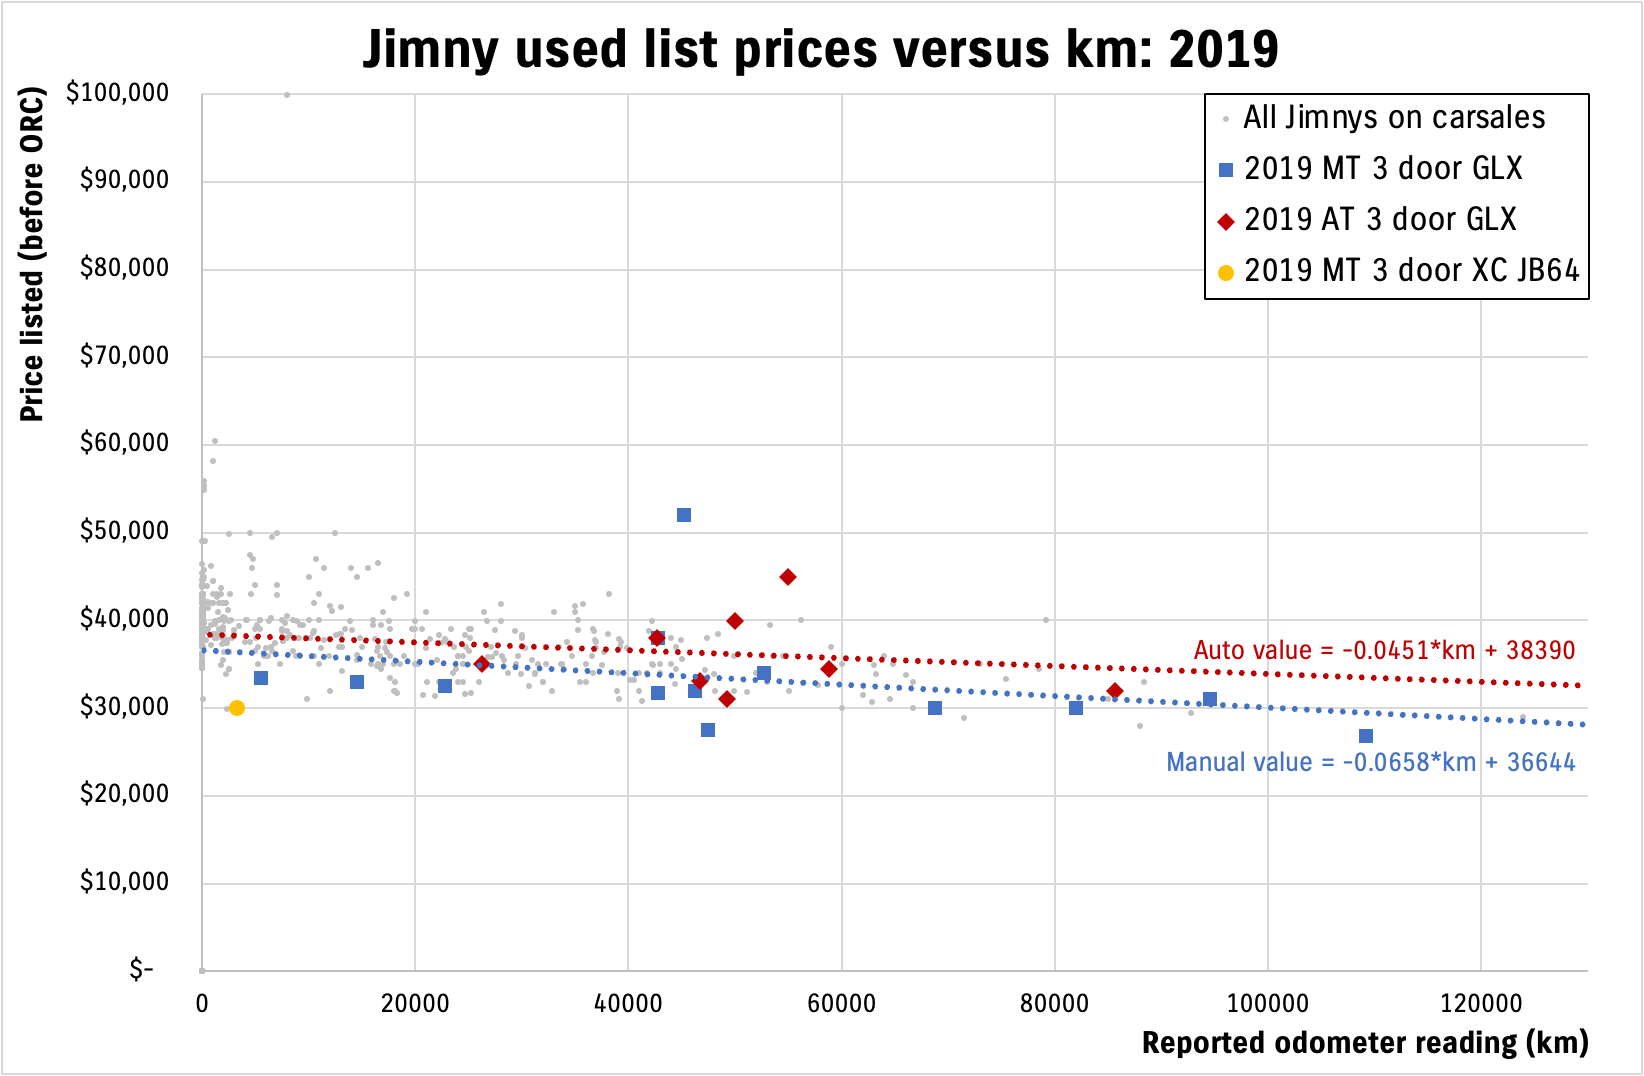
Automatics appear to hold their value better than a manual car, though the highest priced vehicle is a (modified) manual. That one high manual value holds up the base value estimate of the manuals as a whole, but this base value difference of nearly $2k just on the raw analysis suggests automatics hold their value much more in the used market. Redbook values are lower than listed prices but also for higher km vehicles than most of those listed.
| Statistic | Odometer listed (km) | Listed price ($) |
|---|---|---|
| Lowest | 3,302 km | $26,800 |
| Highest | 109,200 km | $52,000 |
| Average | 49,186 km | $34,017 |
| Median | 46,750 km | $32,490 |
| 25-75% range | 40,791 – 56,911 km | $31,000 – $34,745 |
| Redbook data | 80,000 – 130,000 km | $24,450 – $29,500 manual $26,200 – $31,400 automatic |
2020
45 cars listed (7.9% of listed; 1.9% of 2020 cars sold new)
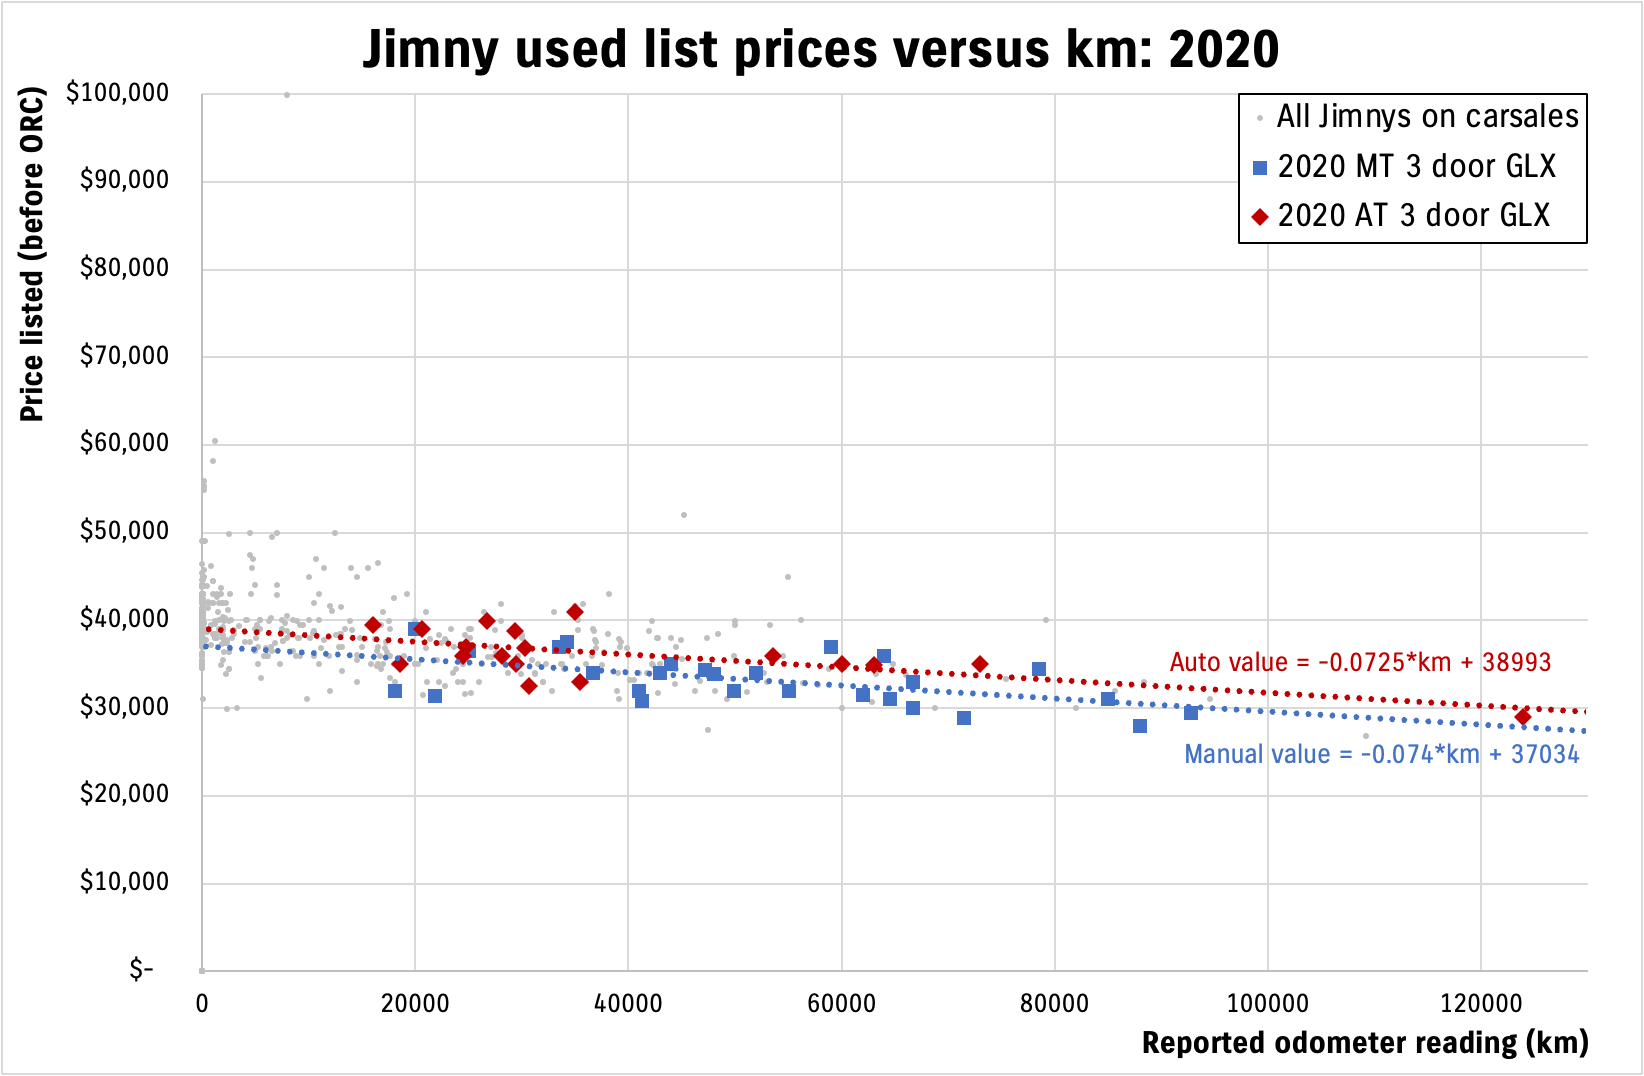
Automatics once against demonstrate their higher value against manuals here. Depreciation rates are similar per km driven, though the automatic depreciation rate might be dragged down by the much higher km reading of one automatic car with > 120,000 km.
| Statistic | Odometer listed (km) | Listed price ($) |
|---|---|---|
| Lowest | 16,000 km | $27,989 |
| Highest | 123,888 km | $41,000 |
| Average | 47,389 km | $34,337 |
| Median | 42,931 km | $34,490 |
| 25-75% range | 29,328 – 63,000 km | $31,990 – $36,500 |
| Redbook data | 60,000 – 100,000 km | $27,150 – $30,800 manual $28,800 – $32,650 automatic |
2021
62 cars listed (10.9% of listed; 1.85% of 2021 cars sold new)
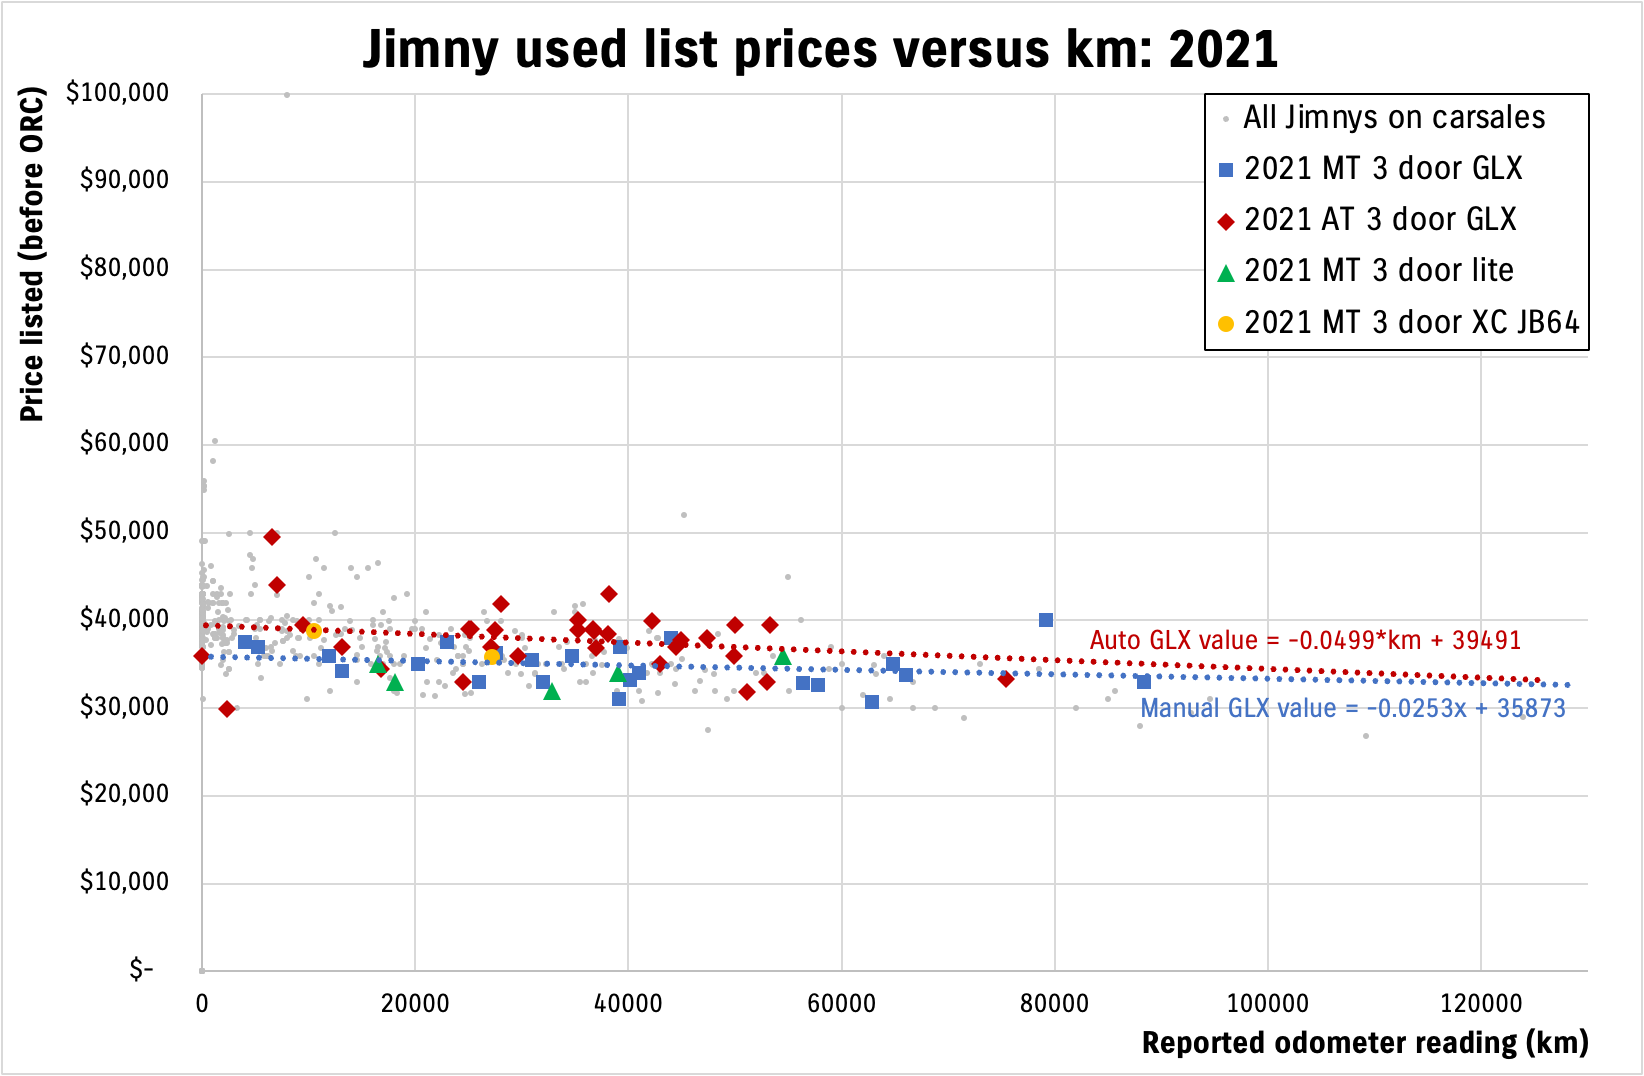
2021 is the first year of the introduction of the lite. It’s a bit messy to include a trend line on the lite values, but basically they’re just a little below a manual GLX. They possibly drag all manual values down with people not necessarily differentiating between the two; a lower ‘0 km’ intercept means the slope of the depreciation curve has to be shallower to keep up with the other (and fewer) values off to higher km (i.e. not saying I totally believe a 2021 manual only depreciates 2.5 ¢/km).
Rough guess is that lites are ~$1000 cheaper than a GLX, which is a little lower cost difference than when the cars were new.
| Statistic | Odometer listed (km) | Listed price ($) |
|---|---|---|
| Lowest | 5 km | $29,900 |
| Highest | 88,400 km | $49,500 |
| Average | 34,847 km | $36,417 |
| Median | 42,931 km | $35,995 |
| 25-75% range | 23,373 – 44,828 km | $33,850 – $38,836 |
| Redbook data | 45,000 – 75,000 km | $25,100 – $28,200 manual lite $30,350 – $34,700 manual GLX $31,500 – $36,000 automatic |
2022
119 cars listed (20.9% of listed; 2.09% of 2022 cars sold new)
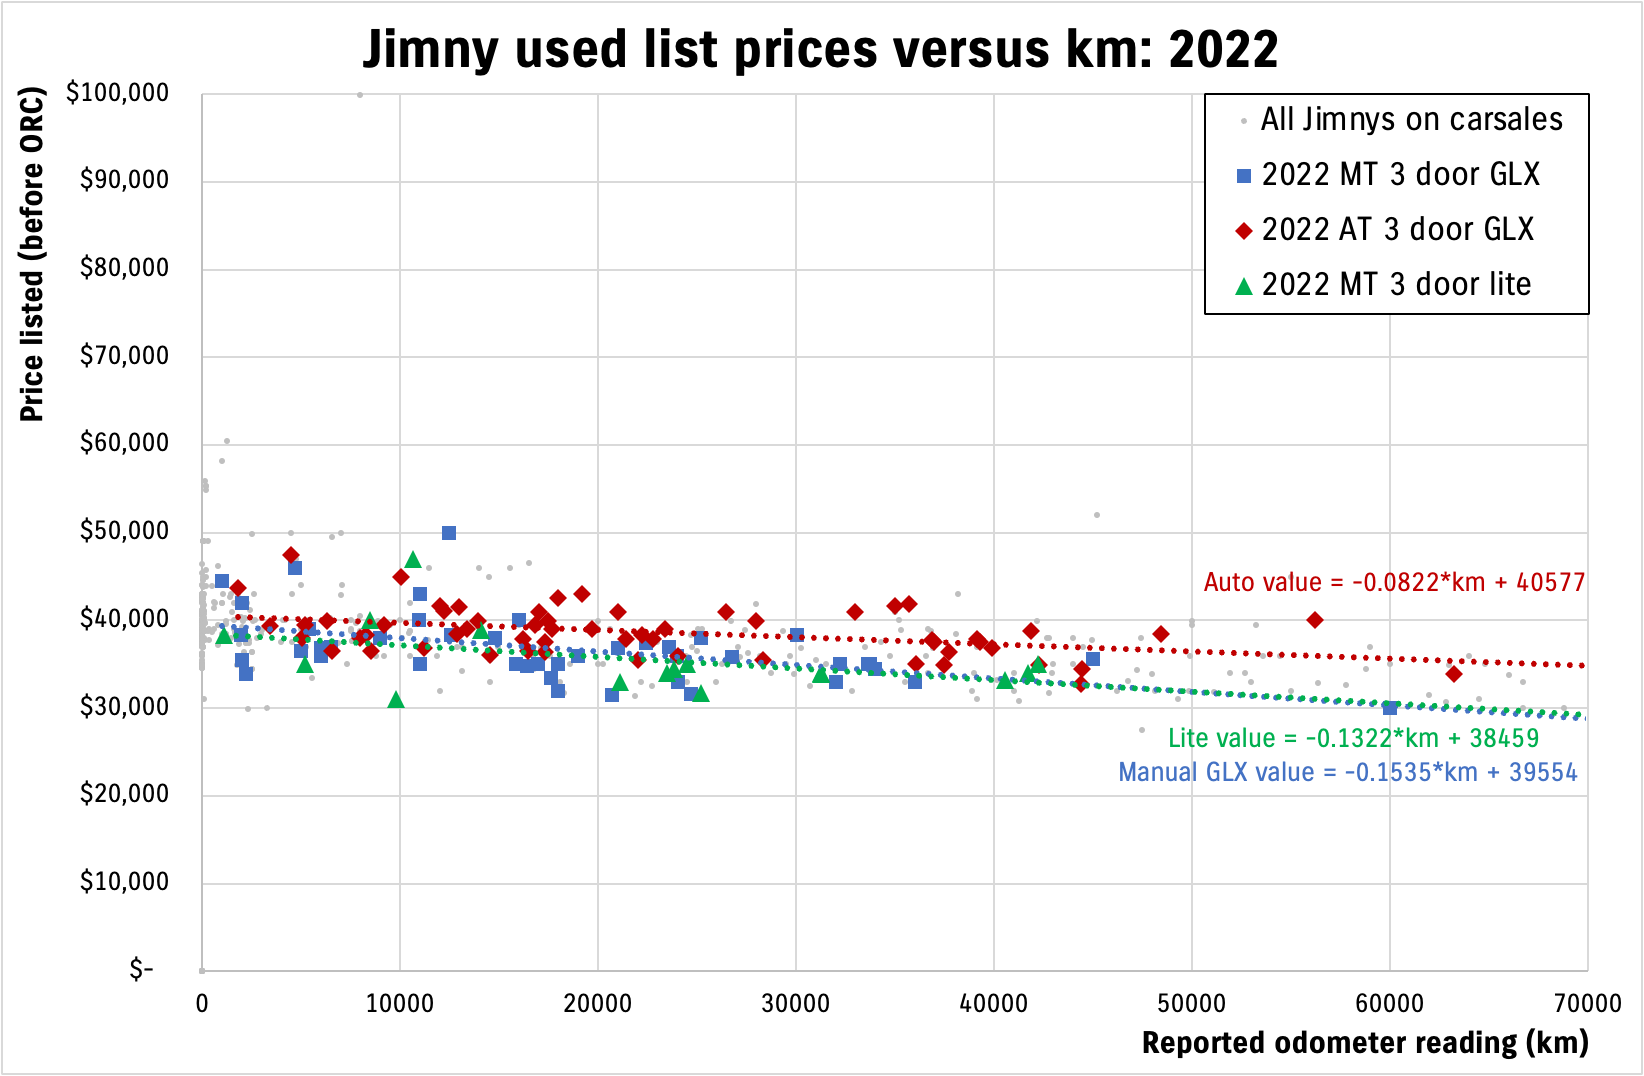
First full year of lites on sale so more options to look at the relative difference between the two specifications of manuals. Lites are dragged up to lower on depreciation cost by lack of higher km examples so there’s some uncertainty, but my gut feeling of ~$1000 difference between lites and manual GLXs seems to be borne out by the data. Autos continue to hold their own well beyond the price difference of the cars when new, and newer cars seem to be showing that they depreciate less than manuals with kms (8 ¢/km vs 13-15 ¢/km). This is probably down to latent demand/lack of supply meaning people will go after any auto. 13-15 ¢/km is still relatively good going on a lot of cars when looking at the manual cars.
| Statistic | Odometer listed (km) | Listed price ($) |
|---|---|---|
| Lowest | 1,001 km | $30,000 |
| Highest | 63,237 km | $49,999 |
| Average | 21,238 km | $37,532 |
| Median | 18,000 km | $37,500 |
| 25-75% range | 10,983 – 31,272 km | $34,990 – $39,500 |
| Redbook data | 30,000 – 50,000 km | $29,300 – $32,150 manual lite $30,750 – $40,200 manual GLX $36,100 – $41,450 automatic |
2023
156 cars listed (27.4% of listed; 3.12% of 2023 cars sold new)
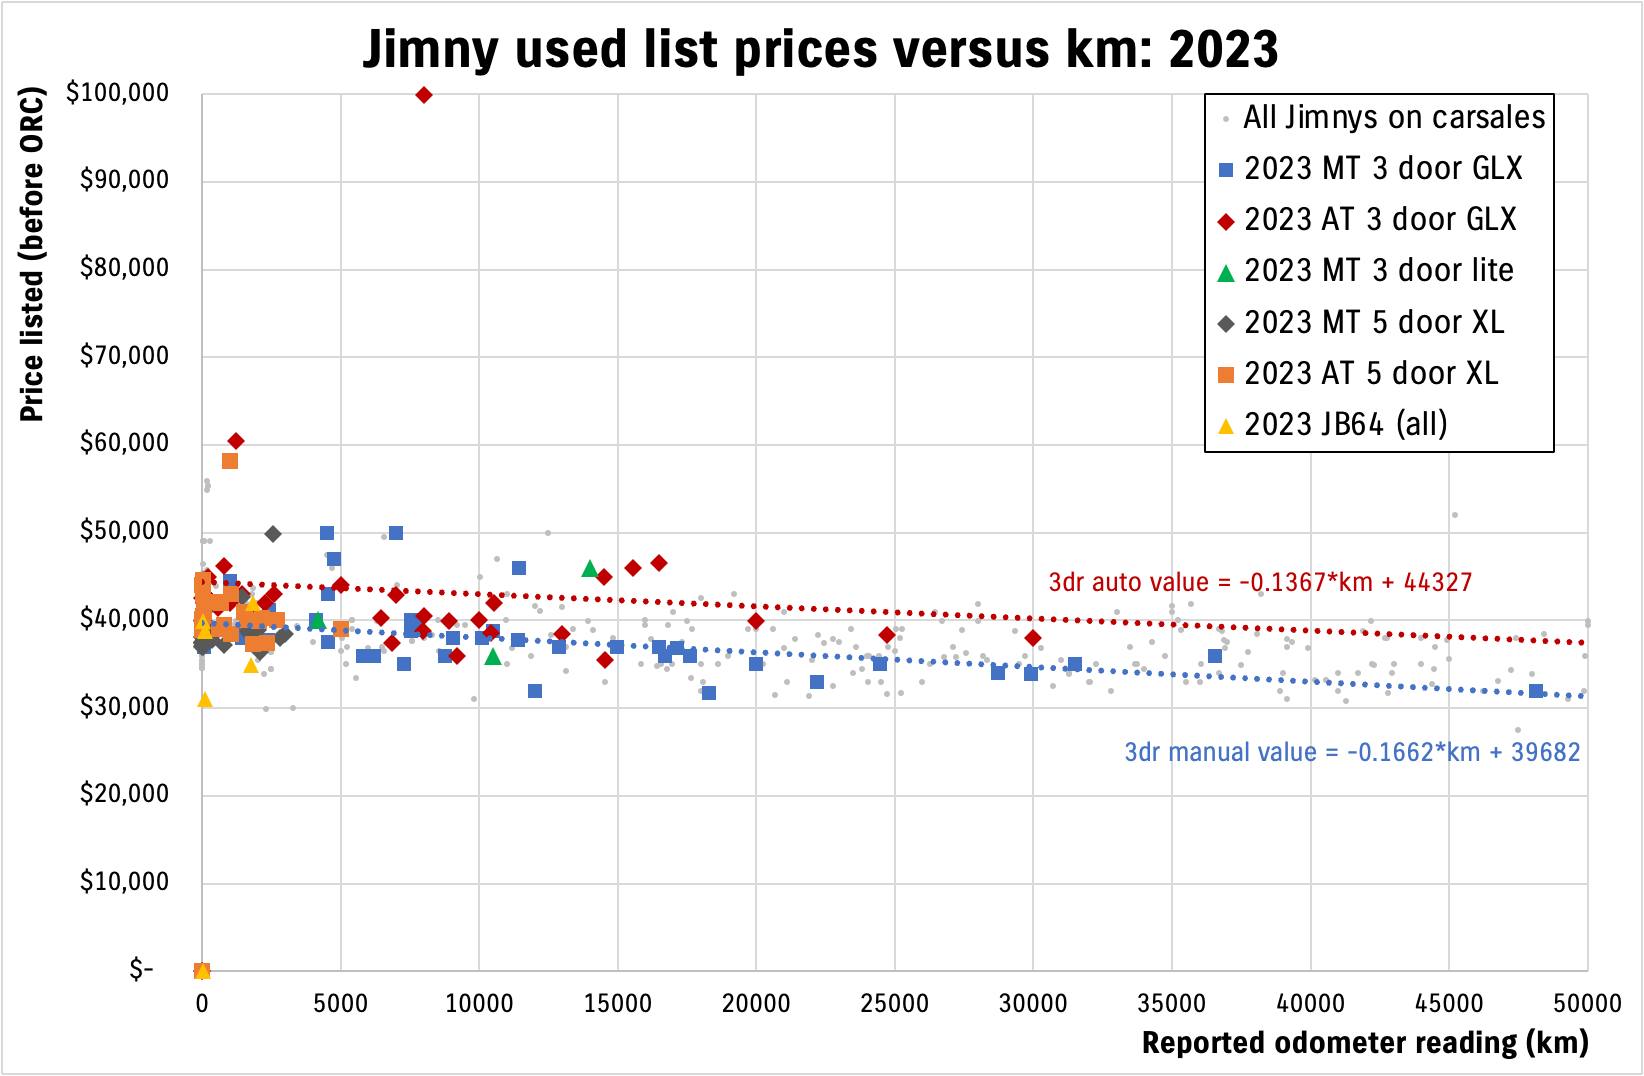
First year with 5 door XL models (albeit only available from December onwards, and most listed are ex demos). The sheer number of ex demos makes it hard to assess the trends of 5 doors with higher km as they are all low km examples, which makes sense as they’ve been on the market for only 7 months.
More of a clear separation between manual and automatic values, which have similar depreciation trends of ~14-16 ¢/km. Automatic availability becomes quite apparent here, with buyers potentially wanting cars in stock rather than waiting a year or so for a 3 door. Note that a lot of 3 door automatics are listed (even by dealerships – not private sellers wanting a profit!) at higher prices than 5 door automatics, indicating there is perhaps more demand/less supply of the 3 doors versus the 5 doors. This is backed up by the price ranges through Redbook, where automatic 3 doors command more than 5 doors, though lower trading volume of 5 doors might skew this.
There are also a few more imported JB64 kei class models available as 2023 vehicles, though not enough to make a trend analysis. There’s also very few lites available and those that are are much closer in pricing to GLX manuals.
| Statistic | Odometer listed (km) | Listed price ($) |
|---|---|---|
| Lowest | 0 km (19 cars) | $31,000 (9 cars with no price) |
| Highest | 48,135 km | $99,888 |
| Average | 6,203 km | $37,962 |
| Median | 1,643 km | $38,995 |
| 25-75% range | 59 – 7,987 km | $37,202 – $41,613 |
| Redbook data | 15,000 – 25,000 | $31,250 – $34,200 manual lite 3 door $32,100 – $40,500 manual GLX 3 door $38,300 – $41,750 automatic GLX 3 door $30,950 – $33,900 manual XL 5 door $31,700 – $34,650 automatic XL 5 door |
2024
164 cars listed (28.8% of listed; 3.53%* of 2024 cars sold new to June 2024)
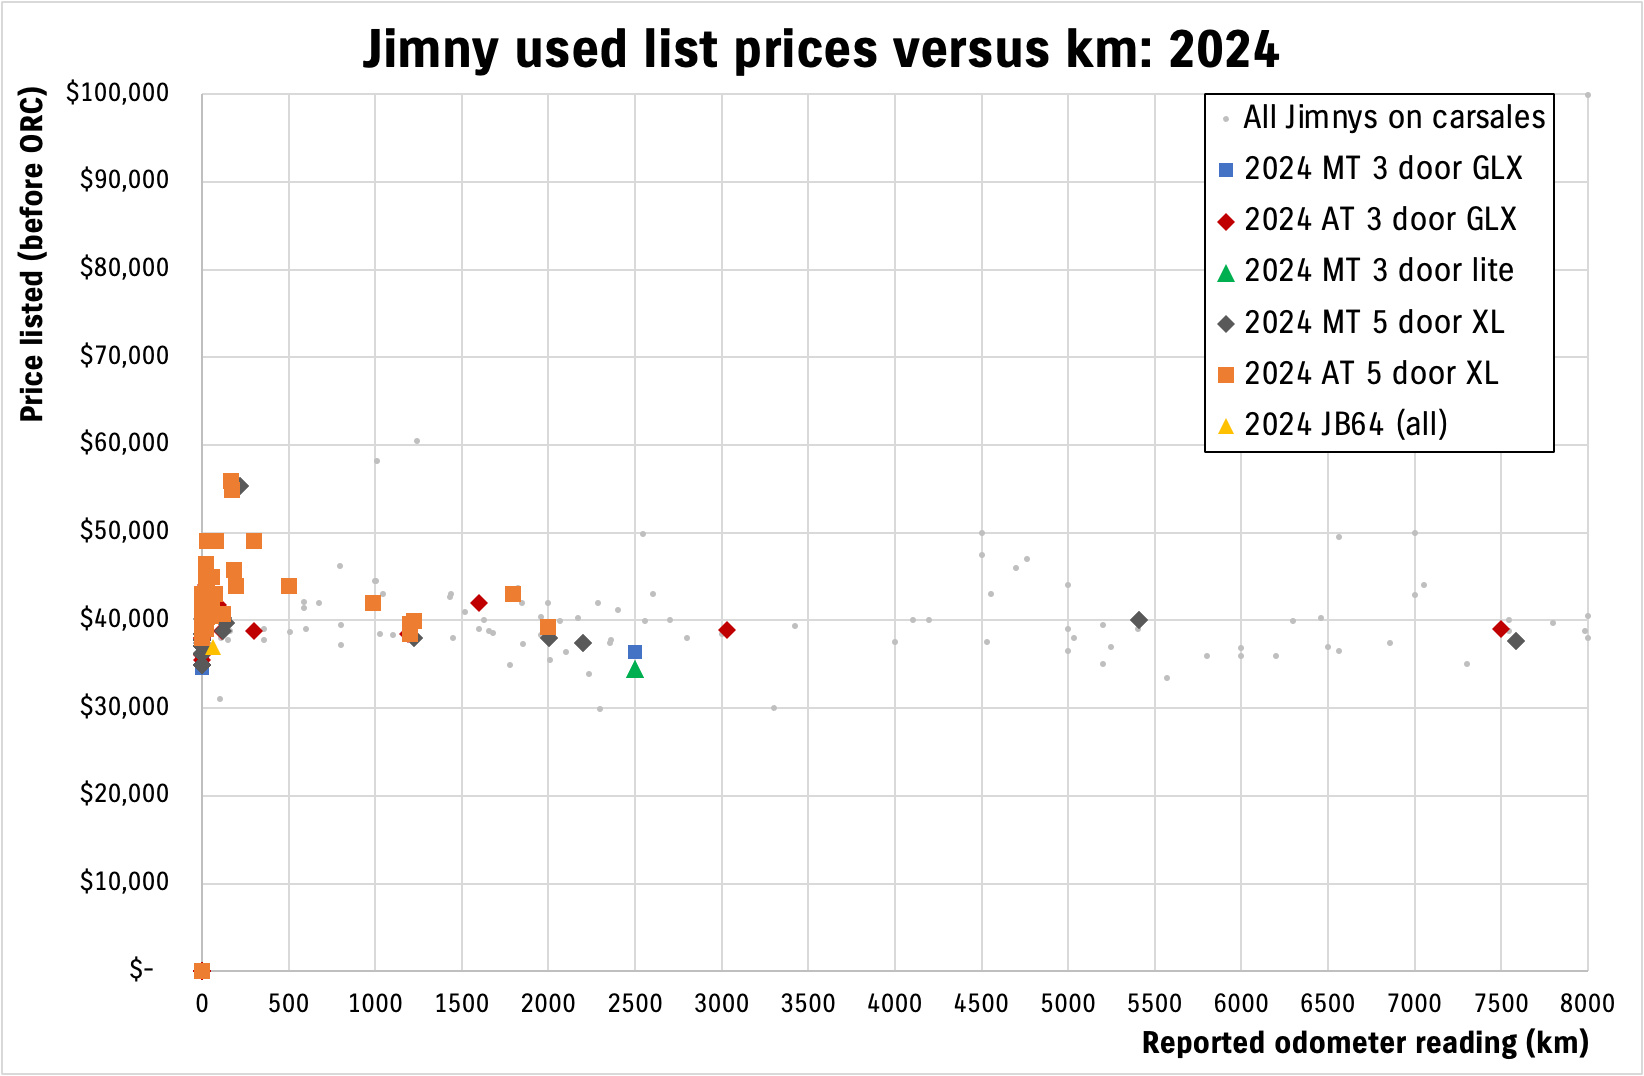
* is a caveat on the % of total sale numbers: I have estimated June 2024 sales numbers to get this out on June 30, but will revise % when I have official sales numbers from VFACTS.
2024 listings are dominated by 0 km new or near new demos. Of note, there are 54 manual and 74 automatic 5 door cars listed, most of which are 0 to minor km vehicles. This means over 75% of the 2024 cars listed are 5 doors and they are ‘in stock’ vehicles or ex demo rather than other ones for sale. Some of these have had a bunch of options thrown at them and are listed at very high prices, but in general automatic 3 doors are listed at slightly higher prices than automatic 5 doors, other than cars listed at their RRP as demos.
With few km done on any vehicle there is no point doing an analysis to estimate depreciation for these cars.
| Statistic | Odometer listed (km) | Listed price ($) |
|---|---|---|
| Lowest | 0 km (75 cars) | $34,493 (20 cars with no price) |
| Highest | 7,583 km | $55,888 |
| Average | 446 km | $40,207 |
| Median | 10 km | $38,842 |
| 25-75% range | 0 – 83 km | $36,125 – $41,990 |
| Redbook data | 0 km | $30,640 manual lite 3 door $32,140 manual GLX 3 door $34,490 automatic GLX 3 door $35,140 manual XL 5 door $37,490 automatic XL 5 door |